

Executive Summary
ARK’s flagship Fund, the ARK Innovation ETF (ARKK), rebounded swiftly and meaningfully during the first half of 2025, its rapid appreciation now potentially concerning some investors that ARKK is susceptible to a reversion. We understand those concerns and address them in this Note. Our research shows that standard technical indicators for ARKK, such as the 14-day relative strength index (RSI),1 are exhibiting elevated values of 76.7 versus the usual level of 70, indicating overbought conditions. On the other hand, our research also suggests that active management of ARKK and changes we expect in regulatory and macroeconomic environments together support the thesis that ARKK is poised for continued strength through the second half of 2025 (2H’25).
The ARKK ETF, and to a lesser extent the US equity market, has recovered from a sharp sell-off in response to negative economic growth data for Q1’25 and adverse trade policy announcements by the Trump Administration, culminating in the shocking reciprocal tariff announcements on April 2, 2025. The year-to-date (YTD) drawdowns for the broader equity indices2 and ARKK reached bear market territory by April 8, before beginning a sharp rebound triggered by Trump’s pause of the reciprocal tariff policies on April 9, 2025. Between April 8 and June 24, 2025, at close, ARKK (NAV) has returned 73.54% while some broad market indices like the the Nasdaq 100 Index have recovered about 29.74%.
.png)
*Annualized. Past performance does not guarantee future results. The performance data quoted represents past performance and current returns may be lower or higher. The investment return and principal will fluctuate so that an investor's shares when redeemed may be worth more or less than the original cost. For the Fund’s most recent month end performance, please visit www.ark-funds.com or call 727.810.8160. Returns for less than one year are not annualized. As stated in the ARK ETFs' current prospectuses, the expense ratio for ARKK is 0.75%. Extraordinary performance is attributable in part due to unusually favorable market conditions and may not be repeated or consistently achieved in the future.
Additional information about fees and expense levels can be found in the ARK ETFs' prospectuses. Net asset value (“NAV”) returns are based on the dollar value of a single share of an ARK ETF, calculated using the value of the underlying assets of the ARK ETF minus its liabilities, divided by the number of shares outstanding. The NAV is typically calculated at 4:00 pm Eastern time. Market returns are based on the trade price at which shares are bought and sold on the exchange using the last share trade. Market performance does not represent the returns you would receive if you traded shares at other times. Total Return reflects reinvestment of distributions on ex-date for NAV returns and payment date for Market Price returns. The market price of ARK ETF shares may differ significantly from their NAV during periods of market volatility. ARK's actively managed ETFs are benchmark agnostic. Index performance provided as a general market indicator. Source: ARK Investment Management LLC. As of June 30, 2025.
Three phenomena have driven that recovery and, taken together, suggest continued upside through 2025:
- The Trump Administration’s pause and reversal of the broad-based reciprocal tariffs;
- Significant improvements in the US inflation outlook and the outlook for US interest rates;
- The prospect of improved US fiscal policy via the passage of the new tax bill, which should spur corporate investment and a recovery in sluggish consumer spending;
- ARKK has hit the Golden Cross indicator, suggesting the possibility of continued gains going forward.
Some market participants suggest that an equity market momentum reversal could occur after the recent rebound. Our research suggests that its existing momentum simply realigns ARKK with its longer-term trend, which we believe is set to continue into the second half of 2025 (2H’25). Furthermore, the combination of macroeconomic tailwinds, strong company fundamentals, and favorable technicals should extend ARKK ‘s recent breakout to the upside. ARKK’s 50-day moving average (MA) has crossed above its 200-day MA— a bullish “Golden Cross” that historically has been a harbinger of extended gains.
The remainder of this Note details how coinciding tailwinds—Trade Policy, Inflation and Interest Rates, the 2025 Tax Bill, and Technical Indicators—support the view that ARKK ‘s rally is poised to extend through the second half of 2025.
Recent Drivers Of ARKK’s Recovery Should Extend Into 2H’25
Trade Policy
The Trump Administration has been negotiating trade deals with major trading partners including China, the EU, the UK, Japan, South Korea, India, Vietnam, Canada, and Mexico, which comprise over 90% of US annual trade. Trump has reduced tariffs with China and made concessions to secure access to its rare earth resources. Trump and Prime Minister Starmer of the UK signed a comprehensive trade deal during the Group of G7 meetings. According to the latest pronouncements by Administration officials, additional trade deals are imminent. The current deadline for renegotiation of reciprocal tariffs is July 9, 2025. We expect to see several major new trade deals completed by that date. We expect that the tariffs on other countries will be reduced to mitigate the negative economic and market effects of overly punitive trade policies.
Inflation And Interest Rates
In the aftermath of the Israel/Iran cease-fire, crude oil has dropped by -12%, closing at a recent level of $64.37 per barrel on June 24, 2025. Despite the lower energy intensity level of the US economy, such a price drop serves as a tax cut for American consumers and businesses, which should result in stronger consumer spending and corporate investment during 2H’25, all else equal. As the Trump Administration continues to support multiple sources of energy production across the US, putting further downward pressure on energy prices, we expect to see US energy prices continue to move lower through the remainder of 2025.
Even prior to the United States’ intervention into the Israel/Iran conflict, inflation in the US had demonstrated significant progress. Between February and May 2025, core Consumer Price Index (CPI)3 surprised to the downside for four consecutive months, averaging 1.5% over that four-month period. Extending the four-month period over the coming year equates to an annualized rate of 1.8%. In his testimony to Congress on June 25, even Federal Reserve (Fed) Chair Powell grudgingly acknowledged significant progress on inflation, joining other members of the Federal Open Market Committee (FOMC), Governor Christopher Waller, Governor Michelle Bowman, and Chicago Fed President Austan Goolsbee, who recently stated that the Fed could be supportive of rate cuts in 2H’25 in the event of completed trade deals and continued progress on trade deal negotiations.
Other indicators consistent with the trend in lower inflation include the following:
- 10-year Treasury yields have rallied by 50 basis points (bps)4 since January highs of 4.8% and are entering a seasonally strong period between now and the end of August 2025.
- Fed Funds futures, as of June 24, 2025, are pricing in 2.3 rate cuts.
- 2-year inflation-linked bonds, which are more sensitive to local market conditions, have fallen from April highs of 3.37% to 2.45%, as of the close on June 24, 2025.
Many investors expect sustained or worsened inflation, but the Bloomberg Inflation Surprise Index data tell a different story, as shown below. We expect that investors will begin to adjust their expectations in-line with the actual data, which indicate a clear and sustained reduction in inflation.
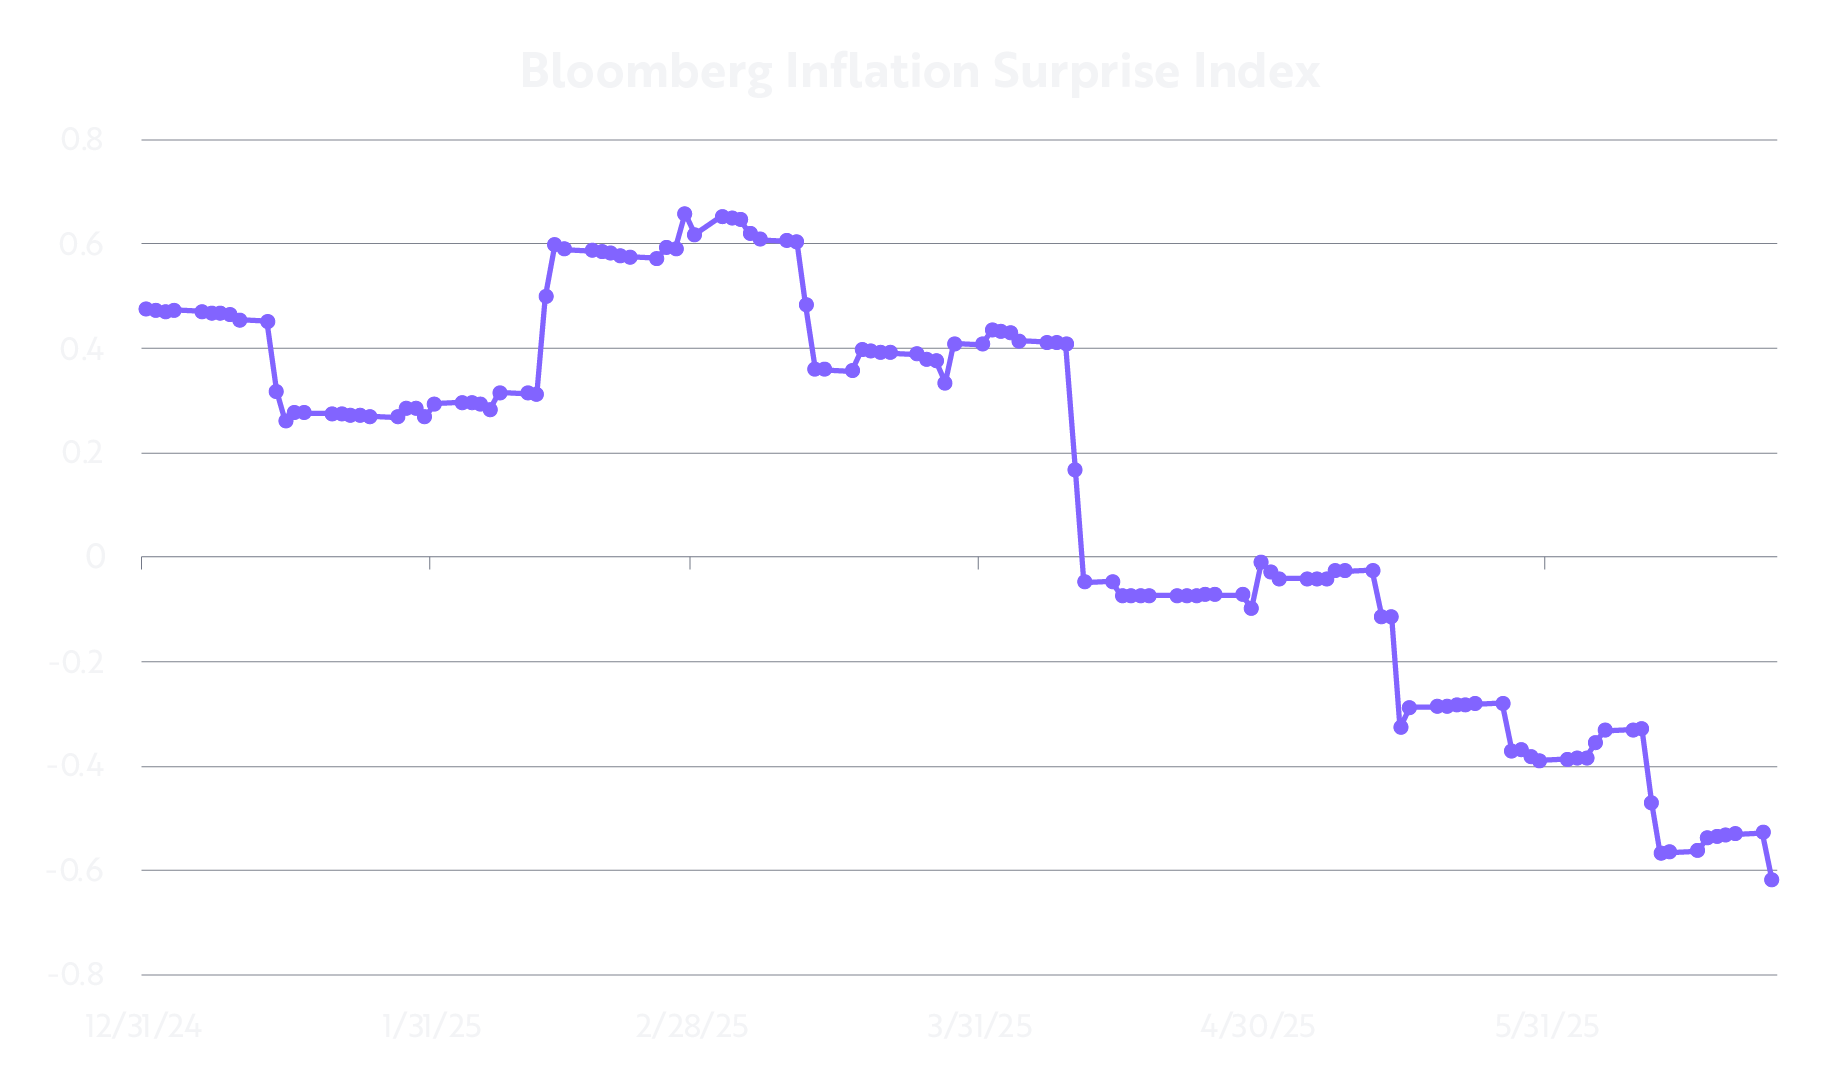
This inflation data surprise index measures the degree to which economic forecasters are under- or over-estimating trends in inflation. Source: ARK Investment Management LLC, 2025, based on data from Bloomberg as of June 24, 2025. For informational purposes only and should not be considered investment advice or a recommendation to buy, sell, or hold any particular security.
The 2025 US Tax Bill
The new “Big Beautiful” tax bill has passed the Senate and has momentum in the House, whose self-imposed deadline is July 4, 2025. Treasury Secretary Bessent is deeply involved in the final negotiations between the Senate and House Republicans and has expressed confidence that they will be able to move the Bill forward by the July 4 deadline. Resolving uncertainty around tax policy and tariff policy would be a potent one-two punch that could trigger a meaningful US macroeconomic rebound in 2H’25 and extends the recovery in US equity markets that began with the pause and subsequent reversal of the reciprocal tariff policies in April.
Technical Indicators Suggest A Sustained Breakout For The ARKK ETF
While some technicians point to the Relative Strength Index (RSI) to understand ARKK and recent trends in equity market momentum, we believe other indicators should be taken into account. The four sub-sections below detail these additional technical considerations:
Market Tops and Bottoms
Technical indicators like the RSI are better at identifying market bottoms than market tops; a market can remain overbought for much longer than it can remain oversold, for example. In the chart below, we denote oversold conditions with the white horizontal line at a relative strength index (RSI) of 30 versus overbought conditions at an RSI level of 70. By doing so, we can see that oversold conditions are quickly reversed, as opposed to overbought conditions, which can persist for an extended period of time.

Source: ARK Investment Management LLC, 2025, based on data from ARK Investment Management LLC as of June 24, 2025. For informational purposes only and should not be considered investment advice or a recommendation to buy, sell, or hold any particular security.
Active Management
When applying technical indicators to an actively managed ETF like ARKK, it is important to consider that the composition of its portfolio changes often. For example, ARKK’s changed considerably between the time the market began to rebound (April 9, 2025) and June 24, 2025: we exited three securities in their entirety, entered five new securities, and rebalanced other outperforming names in the portfolio within that time frame. That matters, because the technical indicators often consulted usually apply to single name securities, to commodities, to static indices, or to ETFs as a whole.
The table below shows the significant weighting changes in the portfolio between April 7 and June 20, 2025. Importantly, Circle’s (CRCL) and CoreWeave’s (CRWV) initial public offerings (IPOs), as well as strong outperformance in other holdings, elevated turnover in the ARKK portfolio.
.png)
Source: ARK Investment Management LLC, 2025, based on data from ARK Investment Management LLC as of June 24, 2025. For informational purposes only and should not be considered investment advice or a recommendation to buy, sell, or hold any particular security. The fund’s portfolio is actively managed and holdings are subject to change.
A Golden Cross
Another important dynamic unlikely to be appreciated by those relying on the RSI, ARKK recently reached a Golden Cross, its 50-day MA having moved above its 200-day MA, as shown below. Historically, a golden cross signals the possibility of an extended rally.
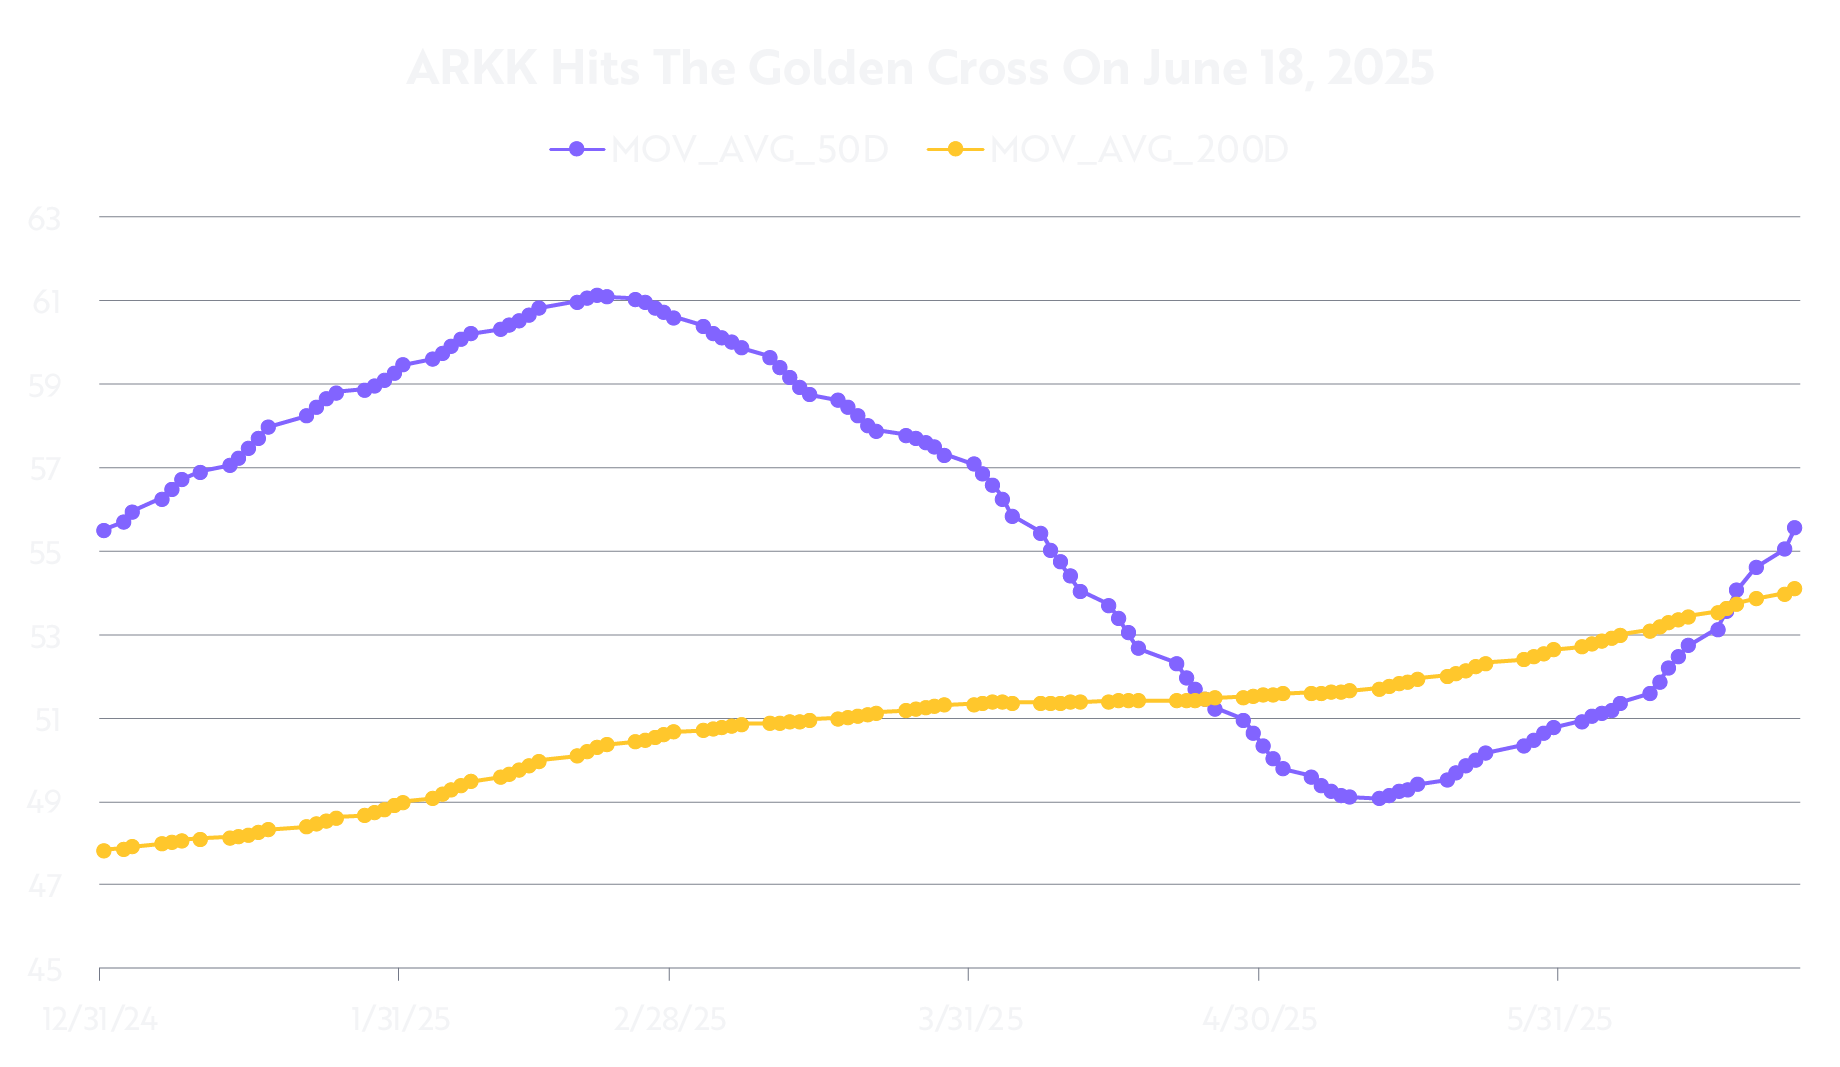
Source: ARK Investment Management LLC, 2025, based on data from ARK Investment Management LLC as of June 24, 2025. For informational purposes only and should not be considered investment advice or a recommendation to buy, sell, or hold any particular security. Past performance does not guarantee future results.
Equity Market Momentum
Equity market momentum, which measures the extent to which outperforming stocks have been outperforming the rest of the market, has been correlated with tariff policy and interest rate trends. As a result, we believe that we could see equity market momentum resume its long-term trend, as shown below.

Source: ARK Investment Management LLC, 2025, based on data from Morgan Stanley as of June 24, 2025. The USA Momentum factor tracks the performance of US large and mid-cap stocks that exhibit higher momentum relative to the broad-based US equity market. For informational purposes only and should not be considered investment advice or a recommendation to buy, sell, or hold any particular security. Past performance does not guarantee future result.
In other words, the recovery of equity market momentum to current levels simply brings equity market momentum back to the trend that began in Q4’24 in association with post-Election optimism around the pro-growth policies of the incoming Administration. Now, a return to that optimism amid other important developments is supporting markets heading into 2H’25, a situation that does not represent overbought conditions, in our view. Overall, US equity markets as measured by the Vanguard Total Market Index (VTI), in the first half of 2025, are up just over 500bps. The last five years of total market returns have averaged close to 1600bps.
Conclusion
In our view, the headwinds that have weighed on innovation are now shifting into structural tailwinds. Broadening market participation, policy shifts supporting emerging technologies like crypto, AI, and healthcare, potential fiscal catalysts like tax cuts, and a normalization of valuation premiums—where innovation now trades closer to market parity than historical norms—are setting the stage for durable equity gains. With inflation surprising to the downside and interest rates poised to follow, we see a favorable macroeconomic backdrop that can sustain momentum through 2H’25 and beyond. As always, we encourage investors to average into positions over time, allowing them to participate in secular growth themes while managing volatility. In our view, the innovation space is not only recovering; it is being fundamentally revalued.
Important Information
Investors should carefully consider the investment objectives and risks as well as charges and expenses of an ARK Fund before investing. This and other information are contained in the ARK ETFs’ prospectuses and summary prospectuses, which may be obtained by visiting www.ark-funds.com. The prospectus and summary prospectus should be read carefully before investing.
An investment in an ARK Fund is subject to risks and you can lose money on your investment in an ARK Fund. There can be no assurance that the ARK Funds will achieve their investment objectives. The ARK Funds’ portfolios are more volatile than broad market averages. The ARK Funds also have specific risks, which are described below. More detailed information regarding these risks can be found in the ARK Funds’ prospectuses.
The principal risks of investing in ARKK include:
Disruptive Innovation Risk. Companies that ARK believes are capitalizing on disruptive innovation and developing technologies to displace older technologies or create new markets may not in fact do so. Companies that initially develop a novel technology may not be able to capitalize on the technology. Companies that develop disruptive technologies may face political or legal attacks from competitors, industry groups or local and national governments. These companies may also be exposed to risks applicable to sectors other than the disruptive innovation theme for which they are chosen, and the securities issued by these companies may underperform the securities of other companies that are primarily focused on a particular theme.
Equity Securities Risk. The value of the equity securities the ARK Funds hold may fall due to general market and economic conditions. Foreign Securities Risk. Investments in the securities of foreign issuers involve risks beyond those associated with investments in U.S. securities. Health Care Sector Risk. The health care sector may be affected by government regulations and government health care programs. Consumer Discretionary Risk. Companies in this sector may be adversely impacted by changes in domestic/international economies, exchange/interest rates, social trends and consumer preferences. Industrials Sector Risk. Companies in the industrials sector may be adversely affected by changes in government regulation, world events, economic conditions, environmental damages, product liability claims and exchange rates. Information Technology Sector Risk. Information technology companies face intense competition, both domestically and internationally, which may have an adverse effect on profit margins.
Additional risks of investing in ARK ETFs include market, management and non-diversification risks, as well as fluctuations in market value NAV. ETF shares may only be redeemed directly with the ETF at NAV by Authorized Participants, in very large creation units. There can be no guarantee that an active trading market for ETF shares will develop or be maintained, or that their listing will continue or remain unchanged. Buying or selling ETF shares on an exchange may require the payment of brokerage commissions and frequent trading may incur brokerage costs that detract significantly from investment returns.
To view the top ten holdings for ARKK click here.
The S&P 500 Index is a stock market index tracking the stock performance of 500 of the largest companies listed on stock exchanges in the United States.
The Nasdaq-100 Index is a stock market index made up of 101 equity securities issued by 100 of the largest non-financial companies listed on the Nasdaq stock exchange.
The Relative Strength Index (RSI) is a technical indicator that measures the magnitude and velocity of recent price changes to evaluate overbought or oversold conditions in the price of a stock or other asset. It is displayed as a line graph oscillating between 0 and 100. Generally, RSI values above 70 suggest that an asset is overbought (potential sell signal), while values below 30 suggest that the asset is oversold (potential buy signal).
In this case, “Broad Based Indices” are the S&P 500 Index and the Nasdaq 100 Index.
Core Consumer Price Index (Core CPI) measures the change in prices of goods and services purchased by consumers, excluding food and energy, which are known for their volatile price movements.
A basis point (bp) is a unit of measurement used in finance to express the change in a percentage, specifically one-hundredth of one percent (0.01%).
ARK’s statements are not an endorsement of any company or a recommendation to buy, sell or hold any security. ARK and its clients as well as its related persons may (but do not necessarily) have financial interests in securities or issuers that are discussed. Certain of the statements contained may be statements of future expectations and other forward-looking statements that are based on ARK’s current views and assumptions and involve known and unknown risks and uncertainties that could cause actual results, performance, or events to differ materially from those expressed or implied in such statements.

ARK Trade Notifications
ARK offers fully transparent Exchange Traded Funds (“ETFs”) and provides investors with trade information for all actively managed ETFs.
