


The Misconceptions Of Innovation And The Potential Perils Of Index Investments
Massive flows of capital into strategies that track market capitalization-weighted indexes[1] seem to be concentrating risk in the global financial system.
Since the turn of the century, our research indicates that funds have been flowing at an accelerated rate into strategies that are looking more and more like one another. During the past 20 years, the sponsors of popular indexes like the S&P 500 Index and the Nasdaq 100 Index have shifted gradually from performance benchmarking[2] to passive-product licensing.[3] At the same time, in response to major risk-off environments like the tech and telecom bust 20+ years ago and the Global Financial Crisis 14 years ago, investors have become more risk averse and increasingly have “hugged” the benchmarks against which they are measured. As assets have moved from active stock selection to more passive rules-based strategies, what once was a reference measure of the market has become the market. With trillions of dollars tracking them,[4] we believe indexes no longer serve as reference portfolios and could be subjecting investors to lower than expected diversification in backward-looking strategies in the face of waves of disruptive innovation, causing real financial risk.
The index methodology of weighting stocks by market-cap is a simple way to track performance but, as “track” implies, the methodology rewards past success and has many shortcomings. Currently, roughly half of U.S. publicly traded equity fund assets are in investment vehicles that track indexes passively.[5] This percentage could be much higher when accounting for benchmark-sensitive active strategies. ARK believes that the massive flow into passive and near-passive strategies during the last 20 years is no longer a recipe for efficient and effective diversification and has created potential concentration risks in financial markets. The following charts illustrate the staggering growth of passive investing in both mutual funds (MFs) and exchange traded funds (ETFs).
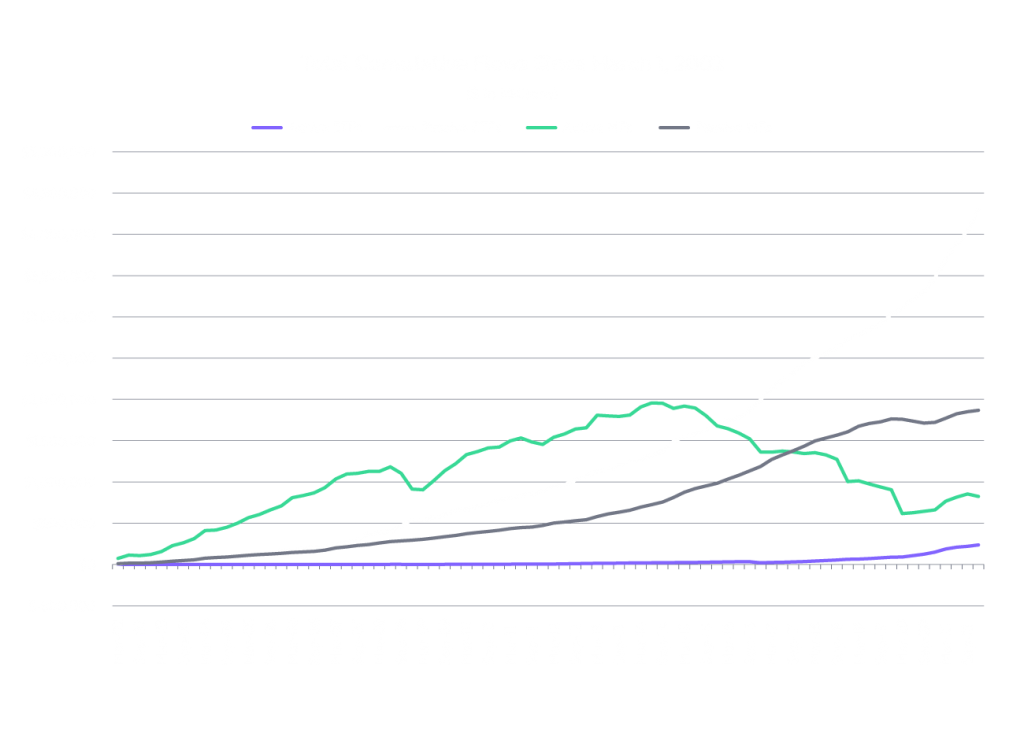
Source: ARK Investment Management LLC, data sourced from a third party (Morningstar).
Note: Represents estimated net flows and total net assets including US Open-End funds and ETFs, while excluding money markets and Fund of Funds. Includes obsolete funds. Exported January 29, 2022. Utilizes quarterly data. Data as of December 31, 2021.
Increasing concentration in holdings across popular indexes could result in uncompensated[6] portfolio risk.
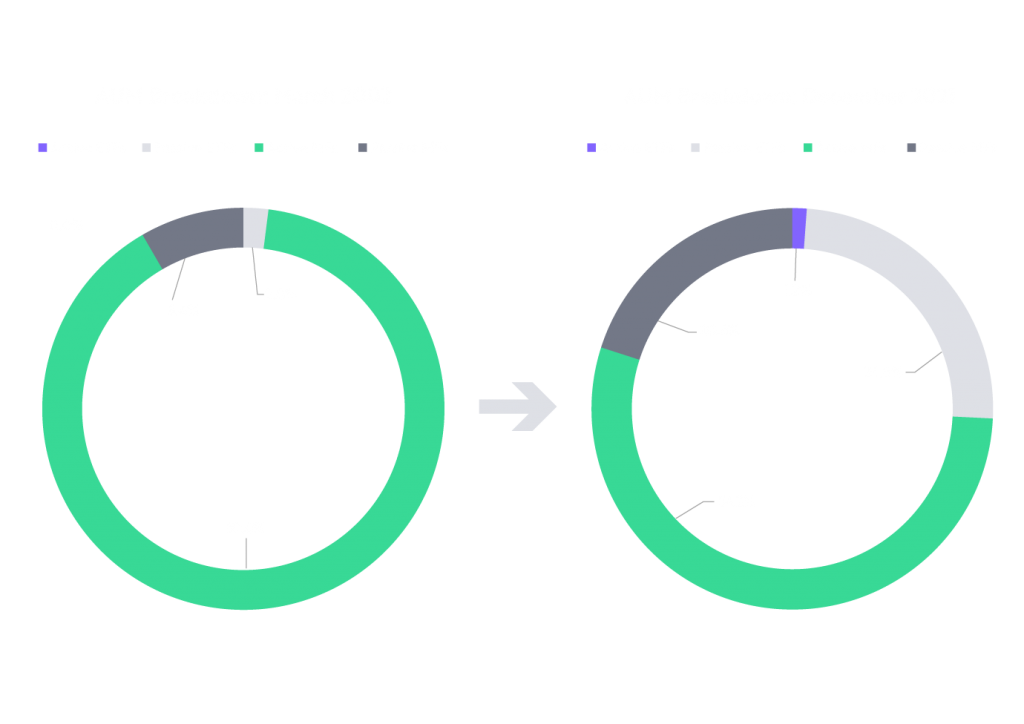
Investors might be surprised to learn that products tracking some of the most widely used benchmarks in the world, the S&P 500 Index and the Nasdaq 100 Index, are beginning to look like one another. Historically, these indexes offered exposure to different slices of the United States equity market. The S&P 500 Index[7] offered core exposure to large market capitalization companies, including both growth- and value-oriented companies, while the Nasdaq 100 Index[8] offered exposure to innovation in the U.S. Because technology and related stocks have outperformed over the years and because of the market-cap weighting of both indices, the S&P 500 Index and the Nasdaq 100 Index seem to be converging. Since March 2002, for example, the common names between the Nasdaq 100 Index and the S&P 500 Index represent a cumulative index weight within the S&P 500 Index that has more than tripled from 12.1% to 42.7% as of December 31, 2021, as shown below. Both held 76 names in common, representing 93.0% of the Nasdaq 100 Index’s cumulative weight, thanks primarily to mega caps[9] like the FAANGs and Microsoft, as shown below.[10] As a result, we believe the Nasdaq 100 Index has evolved from a differentiator and diversifier to an undifferentiated “crowded trade”.
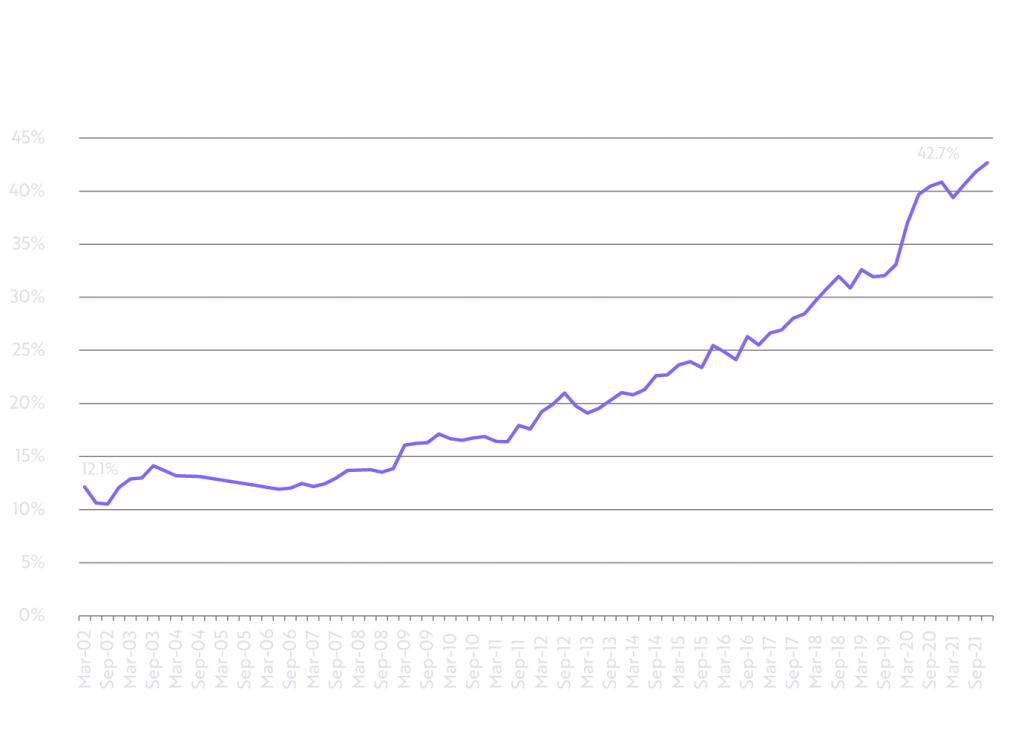
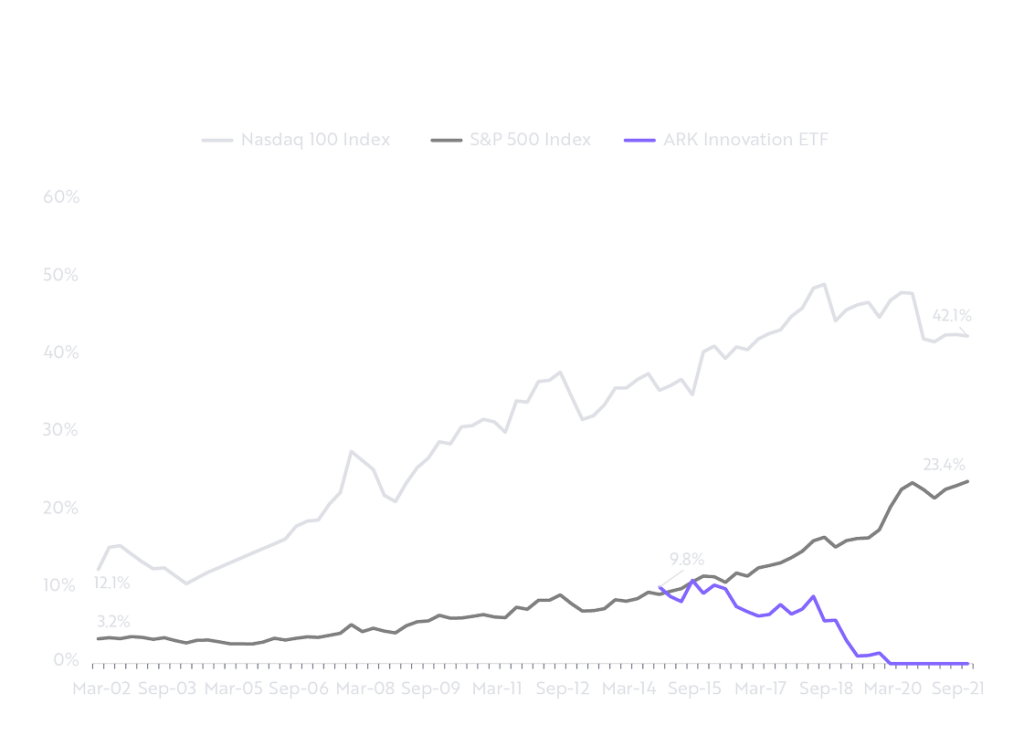
Source: ARK Investment Management LLC, Data sourced from a third party (Morningstar).
Note: Utilizes quarterly data. Data as of December 31, 2021.
Because of their benchmark sensitivity and short-term investment time horizons, actively managed strategies also are beginning to look like one another.
Outperforming broad-based benchmarks has become crucial to the survival of fund managers. To limit “tracking error”[11] relative to the indexes, many benchmark-sensitive active managers now hold similar weights of stocks in the larger index names. As a result, according to an Economic Times study,[12] the average alpha[13] that active large-cap equity managers generated dropped from 4% during 2000-2007 to 1% during 2008-2017, while the average tracking error declined from 10% to less than 4%. Of course the financial crisis of 2008 may have impacted the ability of active managers to deliver alpha. Given the massive volatility around the COVID-19 crisis, we would not be surprised if both alpha and tracking error have continued to fall.
Including the impact of investment fees, we believe the odds are rising that benchmark-sensitive equity managers will underperform their respective benchmarks over the long term. According to Morningstar,[14] only 25% of all active equity funds and 11% of all active large-cap funds have outperformed their respective benchmarks over a recent 10-year period. We believe that as traditional benchmark-focused managers strive to maintain low tracking errors on a quarter-to-quarter basis, modest underperformance is likely to cumulate over time, to the detriment of long-term relative and absolute performance. Given the significant weight of Technology in these indexes, even traditional growth-oriented managers are likely to fall victim to this trend.
As the flood of capital into passive investments continues, investors could be missing out on what we believe is one of the most meaningful investment opportunities in history.
In our view, broad-based indexes do not offer enough, if any, exposure to the massive amount of innovation that potentially could disrupt the traditional world order. The Nasdaq 100 Index, for example, includes many stocks of mature companies, the majority of which would have been considered disruptive innovators 10 to 30 years ago and are ripe for disruption and disintermediation. Meta Platforms (META) is a current case in point, as its privately held competitor TikTok seemed to surface from nowhere and has achieved rapid growth and significant success with its short-form video content. As measured by holdings in any of ARK’s active equity ETFs as of February 28, 2022, in our view only 19 of the Nasdaq 100’s holdings, representing 25% of the index’s weight, are disruptive innovators. Moreover, the Nasdaq 100 Index includes stocks in industries that seem to have little or nothing to do with innovation: railways, dollar stores, brick-and-mortar department stores, and legacy food producers. The S&P 500 Index includes stocks of financial services companies that we believe will be disintermediated[15] by digital wallets[16] and decentralized finance (DeFi)[17], and traditional auto manufacturers and rails that will give way to electric and autonomous cars and trucks.[18] Meanwhile the genomic revolution[19] and artificial intelligence are likely to upend traditional healthcare, compounding the impact of unprecedented disruptive innovation on all industries. Indeed, ARK’s flagship ETF, ARKK, owns none of the technology stocks that comprise 28% of the S&P 500’s Index.[20] In other words, based on ARK’s research and exposures, we believe the risks likely to be caused by disruptive innovation are in the stocks which populate the benchmarks to which many asset managers seem to be tethered.
ARK’s screen for stock selection is not a benchmark: it is our research. In our view, ARK’s research team has deep industry and domain expertise in the transformative technologies that it analyzes from both a top-down and bottom-up perspective. We have created an open-research ecosystem that allows for an organized exchange of insights among our portfolio managers, our director of research, analysts, and—importantly—external thought leaders. We believe this innovative approach to research gives us an edge in identifying themes, modeling technologies, and selecting stocks that may be underappreciated by many investment analysts.
ARK is a benchmark-agnostic equity manager: we do not pick stocks based on any index. In our view, the leaders and beneficiaries of disruptive innovation – from Artificial Intelligence (AI), Robotics, Genomics, and Energy Storage, to Blockchain Technology – are underrepresented by, and more often absent from, the broad-based benchmarks. Indeed, as of February 28, 2022, ARKK and the Nasdaq 100 Index shared only two holdings: Tesla (TSLA) and Zoom (ZM) which accounted for 15.0% of ARKK[21] but only 4.2% of the NASDAQ 100 Index. Compared to the S&P 500 Index, ARKK’s overlap was only 2.0%. In other words, the “active share” in ARK’s strategies is high, as illustrated below.[22]
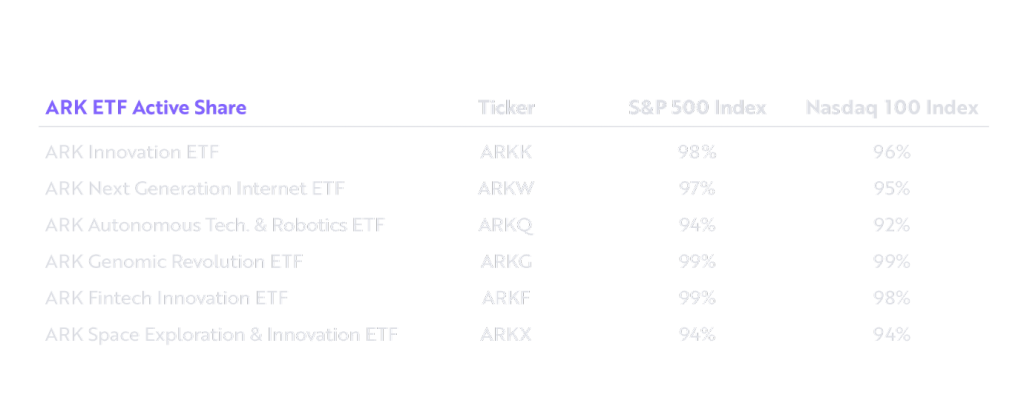
Source: ARK Investment Management LLC, as of February 28, 2022.
Note: ARK’s actively managed ETFs are benchmark agnostic.
To the extent that they do focus on stocks of truly disruptive companies, index providers tend to add them after long periods of upside performance. The S&P 500 Index did not add Tesla (TSLA) until December 21, 2020,[23] for example, missing 760%, 119%, and 72% in 1-, 3-, and 5- year appreciation at an annual rate through December 18, 2020, respectively. Since ARKK added TSLA on October 30, 2014, the inception of the fund, TSLA has appreciated 49% at a compound annual rate through February 28, 2022.[23]
Based on ARK’s research, the market capitalization of companies associated with disruptive innovation will ramp from $14 Trillion USD in 2020 to $210 Trillion USD by 2030, an opportunity largely absent from broad-based benchmark indexes.
While disruptive innovation is controversial and the stocks are volatile in the short term, the longer-term opportunity could be profound, offering sustained and significant annualized growth.
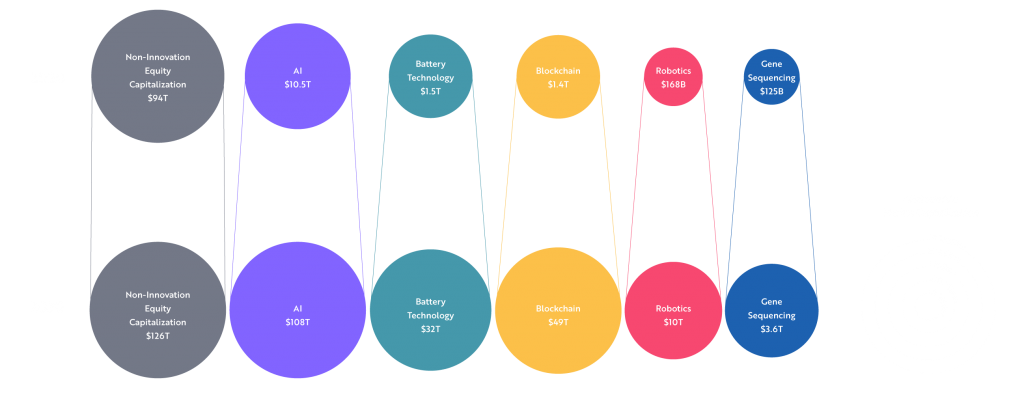
AI: Artificial Intelligence. Source: ARK Investment Management LLC, 2021 based on data from World Federation of Exchanges. Forecasts are inherently limited and cannot be relied upon. For informational purposes only and should not be considered investment advice, or a recommendation to buy, sell or hold any particular security/cryptocurrency. Forecast is compilation of forecasts for the 14 technologies that ARK defines as underlying the 5 innovation platforms. Assumes that traditional equity market exposures continue to compound value at a rate in excess of inflation and are not substantially disrupted or marked down by negative exposure to innovation. Cryptoassets are likely to be increasingly considered a different asset class by many; comparisons between cryptoasset values and equity market capitalization are cross-asset comparisons. Numbers rounded. The compound annual growth rates for the underlying technologies in the portfolio do not represent or predict fund performance. There is no guarantee the Ark ETFs will produce the desired results.
In our view, the flight of capital to passive funds has lowered the diversification offered by “different” strategies that are concentrated in the incumbents that are ripe for disruption. We encourage investors to focus on the concentration in their portfolios and asset allocation strategies, whether in passive investments or in active benchmark-sensitive strategies and, in consultation with a financial professional, evaluate the opportunity to diversify with and benefit from strategies focused on disruptive innovation.
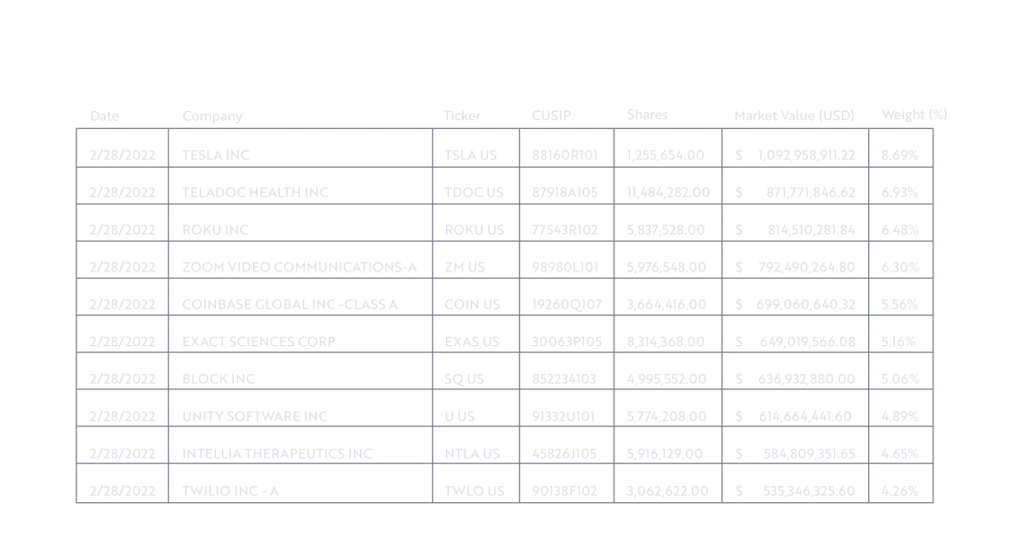
Current and future portfolio holdings are subject to change. For current ARKK ETF portfolio holdings go to ark-funds.com/funds/arkk/.
Important Information
Past performance does not guarantee future results.
ARK’s actively managed ETFs are benchmark agnostic. Index performance provided as a general market indicator. Indexes are unmanaged. It is not possible to invest directly in an index.
Investors should carefully consider the investment objectives and risks as well as charges and expenses of an ARK ETF before investing. This and other information are contained in the ARK ETFs’ prospectuses, which may be obtained by visiting www.ark-funds.com. The prospectus should be read carefully before investing.
An investment in an ARK ETF is subject to risks and you can lose money on your investment in an ARK ETF. There can be no assurance that the ARK ETFs will achieve their investment objectives. The ARK ETFs’ portfolios are more volatile than broad market averages. Additional risks of investing in ARK ETFs include equity, market, management, and non-diversification risks, as well as fluctuations in market value and NAV. The ETF’s portfolio is more volatile than broad market averages. Shares of ARK ETFs are bought and sold at market price (not NAV) and are not individually redeemed from the ETF. ETF shares may only be redeemed directly with the ETF at NAV by Authorized Participants, in very large creation units. There can be no guarantee that an active trading market for ETF shares will develop or be maintained, or that their listing will continue or remain unchanged. Buying or selling ETF shares on an exchange may require the payment of brokerage commissions and frequent trading may incur brokerage costs that detract significantly from investment returns.
The principal risks of investing in the ARK ETFs include: Equity Securities Risk. The value of the equity securities the ARK ETF holds may fall due to general market and economic conditions. Foreign Securities Risk. Investments in the securities of foreign issuers involve risks beyond those associated with investments in U.S. securities. Disruptive Innovation Risk. Companies that ARK believes are capitalizing on disruptive innovation and developing technologies to displace older technologies or create new markets may not in fact do so. Companies that initially develop a novel technology may not be able to capitalize on the technology. Companies that develop disruptive technologies may face political or legal attacks from competitors, industry groups or local and national governments. These companies may also be exposed to risks applicable to sectors other than the disruptive innovation theme for which they are chosen, and the securities issued by these companies may underperform the securities of other companies that are primarily focused on a particular theme. Special Purpose Acquisition Companies (SPAC) Risk. A SPAC is a publicly traded company that raises investment capital for the purpose of acquiring or merging with an existing company. Investments in SPACs and similar entities are subject to a variety of risks beyond those associated with other equity securities. Because SPACs and similar entities do not have any operating history or ongoing business other than seeking acquisitions, the value of their securities is particularly dependent on the ability of the SPAC’s management to identify a merger target and complete an acquisition. The ARK ETFs also have specific principal investment risks, which are described below. More detailed information regarding these risks can be found in the ARK ETFs’ prospectuses.
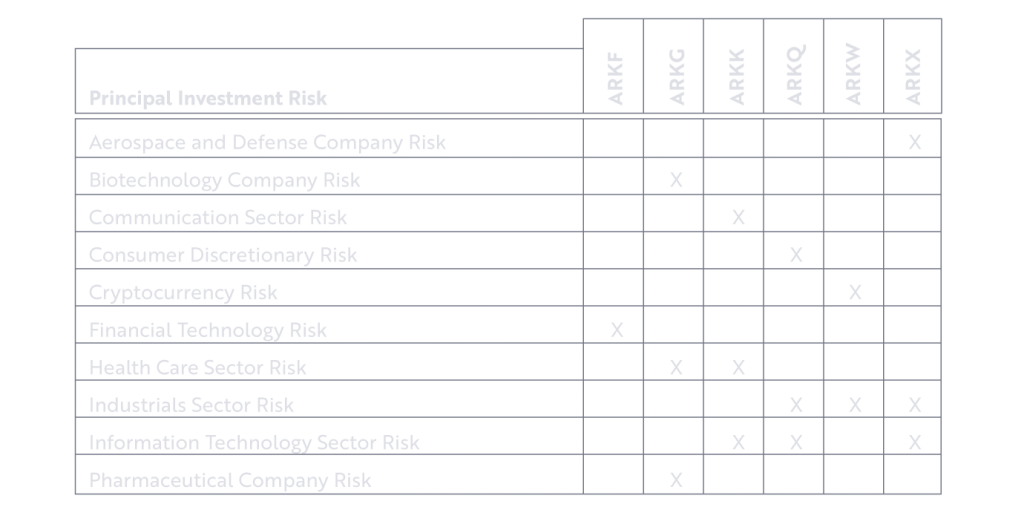
Aerospace and Defense Company Risk. Companies in the aerospace and defense industry rely to a large extent on U.S. (and other) Government demand for their products and services and may be significantly affected by changes in government regulations and spending, as well as economic conditions, industry consolidation and other disasters.
Biotechnology Company Risk. A biotechnology company’s valuation can often be based largely on the potential or actual performance of a limited number of products and can accordingly be greatly affected if one of its products proves, among other things, unsafe, ineffective, or unprofitable. Biotechnology companies are subject to regulation by, and the restrictions of, the U.S. Food and Drug Administration, the U.S. Environmental Protection Agency, state and local governments, and foreign regulatory authorities.
Communications Sector Risk. Companies is this sector may be adversely affected by potential obsolescence of products/services, pricing competition, research and development costs, substantial capital requirements and government regulation.
Consumer Discretionary Risk. Companies in this sector may be adversely impacted by changes in domestic/international economies, exchange/interest rates, social trends, and consumer preferences.
Cryptocurrency Risk. Cryptocurrency (notably, bitcoin), often referred to as ‘‘virtual currency’’ or ‘‘digital currency,’’ operates as a decentralized, peer-to-peer financial exchange and value storage that is used like money. The Fund may have exposure to bitcoin, a cryptocurrency, indirectly through an investment in the Bitcoin Investment Trust (‘‘GBTC’’), a privately offered, open-end investment vehicle. Cryptocurrency operates without central authority or banks and is not backed by any government. Even indirectly, cryptocurrencies may experience very high volatility and related investment vehicles like GBTC may be affected by such volatility. As a result of holding cryptocurrency, the Fund may also trade at a significant premium to NAV. Cryptocurrency is also not legal tender. Federal, state, or foreign governments may restrict the use and exchange of cryptocurrency, and regulation in the U.S. is still developing. Cryptocurrency exchanges may stop operating or permanently shut down due to fraud, technical glitches, hackers, or malware. Many significant aspects of the U.S. federal income tax treatment of investments in bitcoin are uncertain and an investment in bitcoin may produce income that is not treated as qualifying income for purposes of the income test applicable to regulated investment companies, such as the Fund. GBTC is expected to be treated as a grantor trust for U.S. federal income tax purposes, and therefore an investment by the Fund in GBTC will generally be treated as a direct investment in bitcoin for such purposes. See ‘‘Taxes’’ in the Fund’s SAI for more information.
Financial Technology Risk. Companies that are developing financial technologies that seek to disrupt or displace established financial institutions generally face competition from much larger and more established firms. Fintech Innovation Companies may not be able to capitalize on their disruptive technologies if they face political and/or legal attacks from competitors, industry groups or local and national governments. Blockchain technology is new and many of its uses may be untested. Blockchain and Digital commodities and their associated platforms are largely unregulated, and the regulatory environment is rapidly evolving. As a result, companies engaged in such blockchain activities may be exposed to adverse regulatory action, fraudulent activity or even failure.
Health Care Sector Risk. The health care sector may be adversely affected by government regulations and government health care programs, restrictions on government reimbursements for medical expenses, increases or decreases in the cost of medical products and services and product liability claims, among other factors. Many health care companies are heavily dependent on patent protection and intellectual property rights and the expiration of a patent may adversely affect their profitability.
Industrials Sector Risk. Companies in the industrials sector may be adversely affected by changes in government regulation, world events and economic conditions. In addition, companies in the industrials sector may be adversely affected by environmental damages, product liability claims and exchange rates.
Information Technology Sector Risk. Information technology companies face intense competition, have limited product lines, markets, financial resources, or personnel, face rapid product obsolescence, are heavily dependent on intellectual property and the loss of patent, copyright and trademark protections may adversely affect the profitability of these companies.
Pharmaceutical Company Risk. Companies in the pharmaceutical industry can be significantly affected by, among other things, government approval of products and services, government regulation and reimbursement rates, product liability claims, patent expirations and protection and intense competition.
Certain of the statements contained in this presentation may be statements of future expectations and other forward-looking statements that are based on ARK’s current views and assumptions and involve known and unknown risks and uncertainties that could cause actual results, performance, or events to differ materially from those expressed or implied in such statements. The matters discussed in this presentation may also involve risks and uncertainties described from time to time in ARK’s filings with the U.S. Securities and Exchange Commission. ARK assumes no obligation to update any forward-looking information contained in this presentation. ARK and its clients as well as its related persons may (but do not necessarily) have financial interests in securities or issuers that are discussed. Certain information was obtained from sources that ARK believes to be reliable; however, ARK does not guarantee the accuracy or completeness of any information obtained from any third party.
Index Descriptions:
The S&P 500® Index is a widely recognized capitalization-weighted index that measures the performance of the large-capitalization sector of the U.S. stock market.
The NASDAQ-100 Index is a stock market index that includes 100 of the largest, most actively traded, non-financial companies that are listed on the Nasdaq Stock Market.
ARK ETFs are distributed by Foreside Fund Services, LLC.
©2021-2026, ARK Investment Management LLC. No part of this material may be reproduced in any form, or referred to in any other publication, without the express written permission of ARK Investment Management LLC (“ARK”).
A capitalization-weighted index, also known as a market value-weighted index, is a type of stock market index in which individual components of the index are included in amounts that correspond to their total market capitalization (shortened as “market cap”). Source: Investopedia.
A benchmark is a standard against which the performance of a security, mutual fund, or investment manager can be measured. Generally, broad market and market-segment stock and bond indexes are used for this purpose. Source: Investopedia.
Passive-product licensing refers to index providers licensing their indices for the use of passive vehicles that seeks to replicate the performance of the broad equity market or a segment of it by mirroring the holdings of a designated index. Source: Investopedia.
Worldwide indexed assets under management equated to $20.9 trillion as of June 30, 2021 for money managers that participated in Pensions & Investments’ annual survey. Source: Pension & Investments.
Source: Morningstar, data as of 12/31/21.
Refers to taking on risk without receiving a desirable return.
The origin of the S&P 500 goes back to 1923, when Standard & Poor’s introduced a series of indices that included 233 companies and covered 26 industries. The S&P 500, as it is now known, was introduced in 1957. The S&P 500 is highly regarded as a proxy for the U.S. equity market and it is the only stock market benchmark serving as an economic indicator in The Conference Board Leading Economic Index. It has stood for U.S. stock market performance in that context since 1968. Source: S&P Dow Jones Indices.
Since its inception in 1985, the Nasdaq 100 Index may be regarded as the world’s preeminent large-cap growth index. It includes 100 of the largest domestic and international non-financial companies listed on the Nasdaq Stock Market based on market capitalization. Source: Nasdaq.
Mega cap is a designation for the largest companies in the investment universe as measured by market capitalization. While the exact thresholds change with market conditions, mega cap generally refers to companies with a market capitalization above $200 billion. Source: Investopedia.
FAANG is an acronym that represents Facebook (now Meta Platforms), Apple, Amazon, Netflix, and Google (Alphabet). In our analysis, we have grouped Microsoft into this category as well. Passive ETF holdings are used in these exhibits as a proxy for the underlying indices that they track. For the Nasdaq 100 Index, we have smoothed the weight to FAANGM names for select periods where data points were unavailable.
Tracking error is the divergence between the price behavior of a position or a portfolio and the price behavior of a benchmark. Tracking error is reported as a standard deviation percentage difference, which reports the difference between the return an investor receives and that of the benchmark. Source: Investopedia.
Source: The Economic Times, published Oct 2017. https://www.cnbc.com/2021/11/01/in-one-of-the-most-volatile-markets-in-decades-active-fund-managers-underperformed-again.html
Alpha, often considered the active return on an investment, gauges the performance of an investment against a market index or benchmark that is considered to represent the market’s movement as a whole. The excess return of an investment relative to the return of a benchmark index is one definition of the investment’s alpha. Source: Investopedia.
Source: Morningstar Report, CNBC Article based on the respective periods ending June 30, 2021. Article published on Nov 1, 2021. https://www.cnbc.com/2021/11/01/in-one-of-the-most-volatile-markets-in-decades-active-fund-managers-underperformed-again.html
Disintermediation refers to the process of cutting out the financial intermediary in a transaction. It may allow a consumer to buy directly from a wholesaler rather than through an intermediary such as a retailer or enable a business to order directly from a manufacturer rather than from a distributor.
A digital wallet, also known as e-wallet, is an electronic device, online service, or software program that allows one party to make electronic transactions with another party bartering digital currency units for goods and services. See also Crypto Currency Risk in the disclosure section.
Decentralized finance offers financial instruments without relying on intermediaries such as brokerages, exchanges, or banks by using smart contracts on a blockchain. See also Financial Technology Risk in the disclosure section.
An autonomous vehicle is one that can drive itself from a starting point to a predetermined destination in “autopilot” mode using various in-vehicle technologies and sensors.
Genomics is an interdisciplinary field of biology focusing on the structure, function, evolution, mapping, and editing of genomes. A genome is an organism’s complete set of DNA, including all of its genes as well as its hierarchical, three-dimensional structural configuration. The genomic revolution is the enhanced progress of the field of genomics, including the invention of new technologies.
Source: S&P Dow Jones Indices.
Current and future portfolio holdings are subject to change and risk. See below for ARKK’s Top 10 Holdings.
Source: ARK Investment Management LLC, as of December 31, 2021. Active Share is a measure of the percentage of stock holdings in a manager’s portfolio that different from the benchmark index.
Source: Price data for TSLA through Bloomberg. As of February 28, 2022, TSLA represented an 8.7% position weight in the ARKK ETF.
ARK’s statements are not an endorsement of any company or a recommendation to buy, sell or hold any security. ARK and its clients as well as its related persons may (but do not necessarily) have financial interests in securities or issuers that are discussed. Certain of the statements contained may be statements of future expectations and other forward-looking statements that are based on ARK’s current views and assumptions and involve known and unknown risks and uncertainties that could cause actual results, performance, or events to differ materially from those expressed or implied in such statements.
Explore ARK Funds
Featured Funds:
ARK Autonomous Tech. & Robotics ETF
ARK Next Generation Internet ETF
ARK Genomic Revolution ETF
ARK Trade Notifications
ARK offers fully transparent Exchange Traded Funds (“ETFs”) and provides investors with trade information for all actively managed ETFs.
