


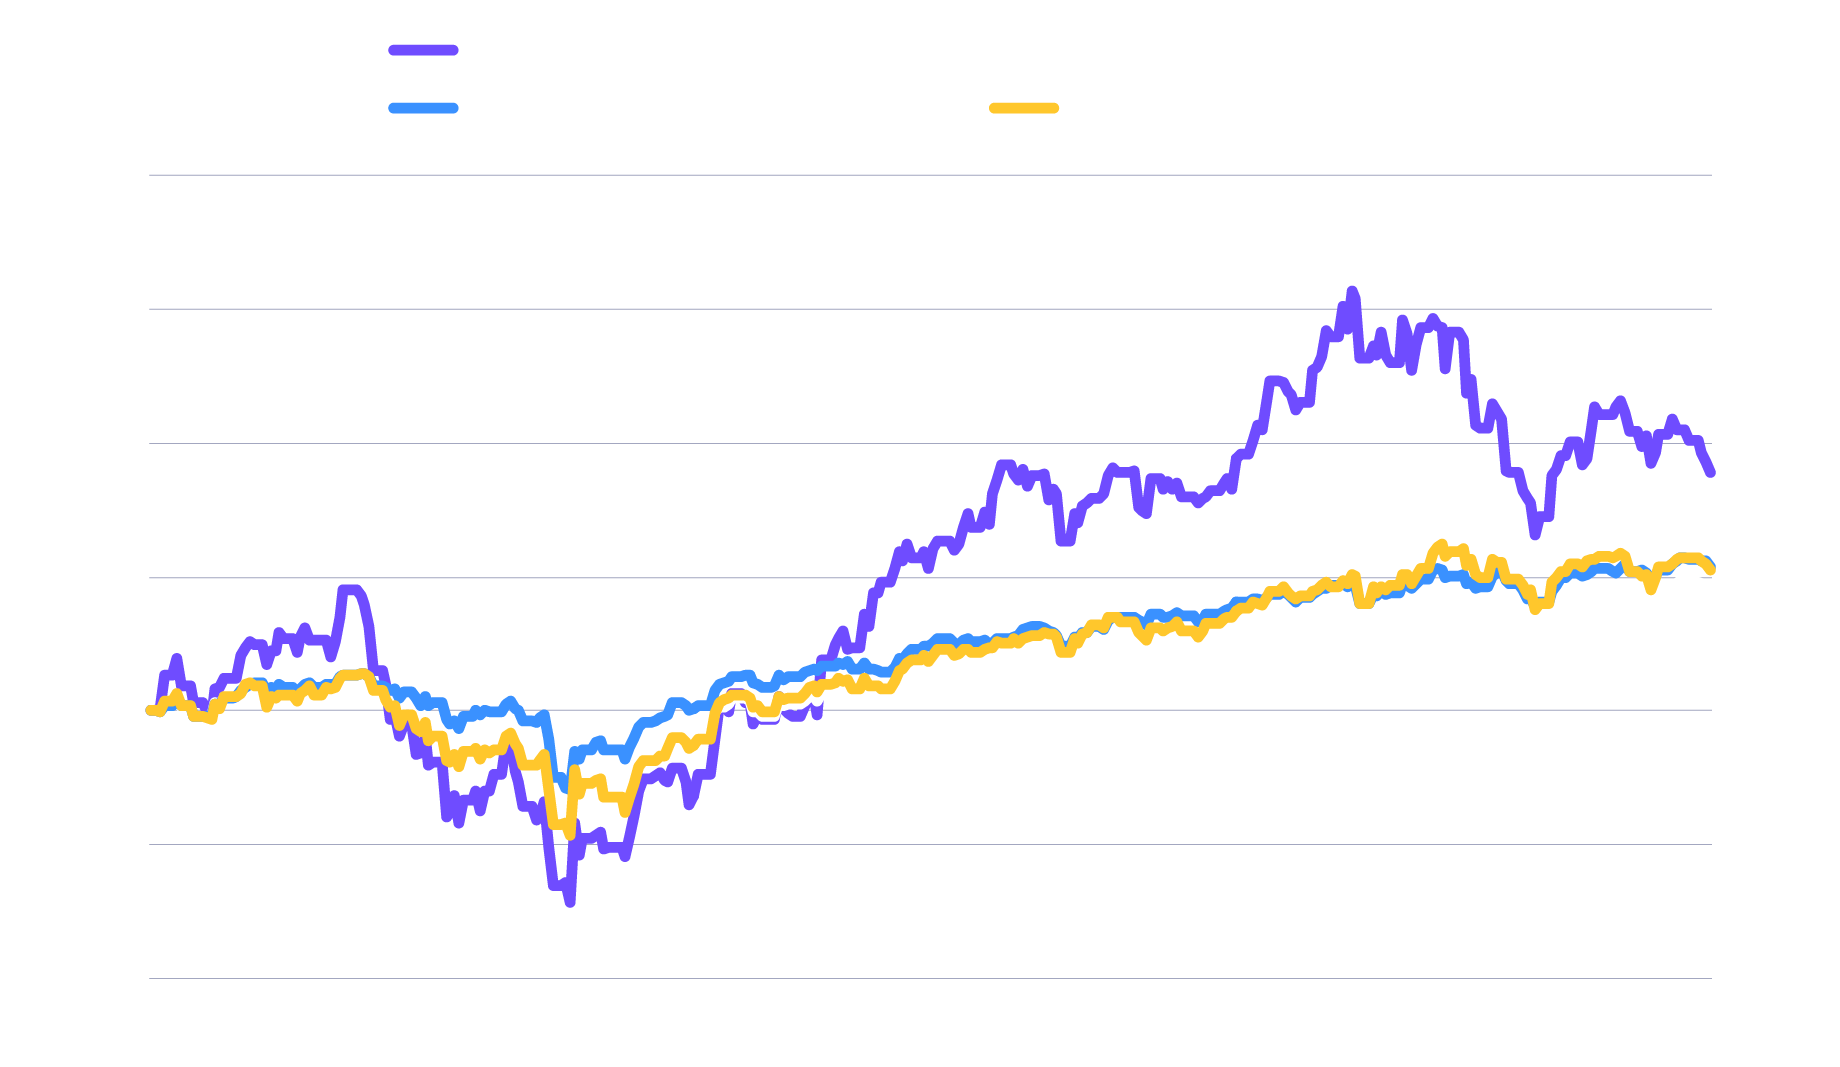
In 2025, investing in innovation regained momentum, scaling a wall of worry built on tariff-related volatility in the first half and renewed concerns about an AI bubble in the second. As uncertainty eased, investors began looking past near-term noise and refocusing on long-term growth amid rapid technological progress. In that environment, innovation strategies outperformed broad equity markets, helped in part by the diversified, pure-play construction of innovation portfolios, which tend to carry high active share versus traditional benchmarks.
The ARK Innovation ETF ("ARKK”) delivered a strong 2025 return of 35.58%, compared with 17.88% for the S&P 500 Index, 21.60% for the MSCI World Index, and 21.02% for the Nasdaq 100 Index. Nevertheless, many investors continue to remain structurally underexposed to innovation.
| Net Returns Since Inception (Oct. 31, 2014) | 3 Months | YTD | 1 Year* | 3 Years* | 5 Years* | 10 Years* | Since Inception* |
| ARKK NAV | -10.45% | 35.58% | 35.58% | 35.02% | -9.00% | 15.01% | 13.60% |
| ARKK Market Price | -10.87% | 35.49% | 35.49% | 34.96% | -9.02% | 14.98% | 13.58% |
| S&P 500 Index (SPX) | 2.66% | 17.88% | 17.88% | 23.01% | 14.42% | 14.82% | 13.65% |
| MSCI World Index (M1WO) | 3.12% | 21.09% | 21.09% | 21.17% | 12.15% | 12.17% | 10.88% |
Past performance does not guarantee future results. The performance data quoted represents past performance and current returns may be lower or higher. The investment return and principal will fluctuate so that an investor's shares when redeemed may be worth more or less than the original cost. For the Fund’s most recent month end performance, please visit www.ark-funds.com or call 727.810.8160. Returns for less than one year are not annualized. As stated in the ARK ETFs' current prospectuses, the expense ratio for ARKK is 0.75%.
Extraordinary performance is attributable in part due to unusually favorable market conditions and may not be repeated or consistently achieved in the future.
Additional information about fees and expense levels can be found in the ARK ETFs' prospectuses. Net asset value (“NAV”) returns are based on the dollar value of a single share of an ARK ETF, calculated using the value of the underlying assets of the ARK ETF minus its liabilities, divided by the number of shares outstanding. The NAV is typically calculated at 4:00 pm Eastern time. Market returns are based on the trade price at which shares are bought and sold on the exchange using the last share trade. Market performance does not represent the returns you would receive if you traded shares at other times. Total Return reflects reinvestment of distributions on ex-date for NAV returns and payment date for Market Price returns. The market price of ARK ETF shares may differ significantly from their NAV during periods of market volatility. ARK's actively managed ETFs are benchmark agnostic. Index performance provided as a general market indicator.
Source: ARK Investment Management LLC. As of December 31, 2025.
We Believe Innovation Is Not A Sector, It’s A Growth Engine
Many investors still treat innovation as a tactical or satellite allocation, sizing it conservatively or trading around it opportunistically. In our view, innovation is worthy of long-term growth exposure because the associated companies are well-positioned to benefit from productivity gains, economic growth, and equity market leadership.
As shown in ARK’s Big Ideas 2026 research, artificial intelligence is accelerating software development and enterprise efficiency. Multiomics is shifting healthcare from treatment to cure. Autonomous systems are redefining transportation and logistics. Digital assets and blockchain networks are modernizing financial infrastructure.
These technologies do not develop in isolation but instead reinforce one another. Their convergence creates exponential growth opportunities that traditional sector labels struggle to capture.
2025: A Turning Point for Innovation Allocations
While innovation strategies remain volatile given technological disruption during macro uncertainty, 2025 demonstrated that volatility does not preclude diversification benefits.
Our research shows that adding a modest allocation to innovation within a diversified global equity portfolio has improved long-term outcomes. Over rolling five-year periods, portfolios that included innovation often experienced higher long-term returns and periods of outsized upside during technological breakthroughs
Importantly, even during major growth drawdowns, portfolios with innovation exposure did not experience disproportionately higher volatility than portfolios without it.
Put simply, innovation tends to reward patience.
A Practical Way To Add Innovation
For investors interested in innovation but cautious about making large portfolio changes, our research suggests a disciplined approach.
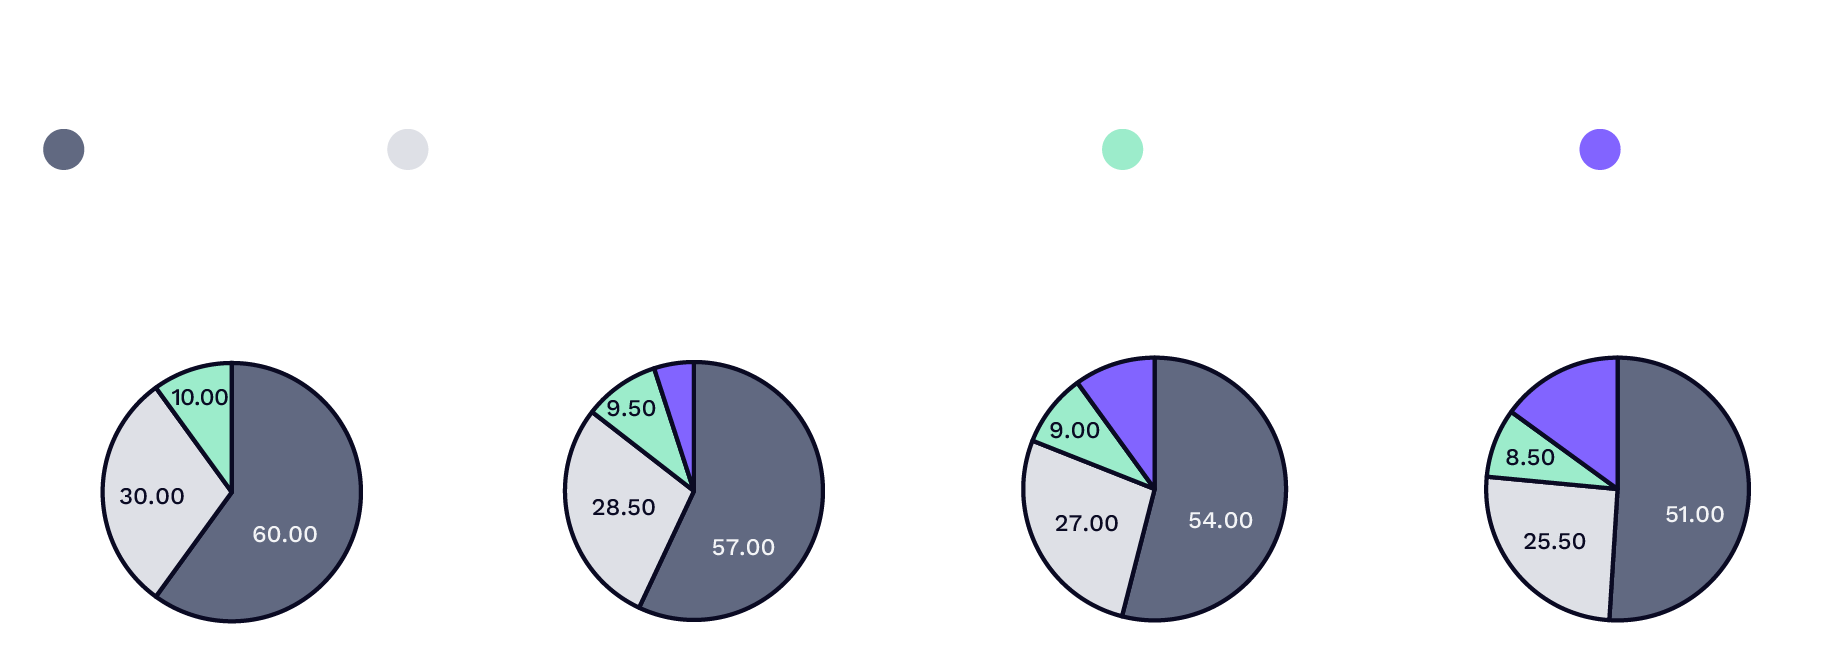
We studied a traditional global equity portfolio loosely represented by market cap weights—60% US equities, 30% international developed equities, and 10% emerging markets—and compared it with similar portfolios that included modest innovation allocations. Even a 5% allocation to innovation improved long-term results across most five-year periods addressed by our analysis.
Just as important, our study used a rebalancing approach that reflects how markets actually move. Instead of rebalancing on a fixed calendar, the strategy adjusts only when allocations drift meaningfully from their targets—in this case, by applying ± 2.5% rebalancing bands. The strategy emphasizes buying the dip and taking profits, adding to innovation after pullbacks and trimming after strong runs, while avoiding overreaction to near-term volatility. The portfolios are outlined below:
Parts of A Global Equity Model Portfolio
| As of December 31, 2025 | 3 Months | YTD | 1 Year* | 3 Years* | 5 Years* | 10 Years* | Since Inception* |
| Representation: US Market | |||||||
| Net Returns Since Inception (Jan. 23, 2004) | |||||||
| ITOT NAV | 2.36% | 17.02% | 17.02% | 22.23% | 13.06% | 14.20% | 10.36% |
| ITOT Market Price | 2.42% | 17.00% | 17.00% | 22.23% | 13.08% | 14.20% | 10.38% |
| Representation: International Developed Market (Ex US) | |||||||
| Net Returns Since Inception (Aug. 17, 2001) | |||||||
| EFA NAV | 4.33% | 31.38% | 31.38% | 17.05% | 8.87% | 8.14% | 6.21% |
| EFA Market Price | 4.72% | 31.55% | 31.55% | 17.24% | 9.00% | 8.24% | 6.26% |
| Representation: Emerging Markets | |||||||
| Net Returns Since Inception (Apr. 11, 2003) | |||||||
| EEM NAV | 4.32% | 33.34% | 33.34% | 15.78% | 3.50% | 7.73% | 9.28% |
| EEM Market Price | 3.93% | 33.98% | 33.98% | 15.84% | 3.55% | 7.81% | 9.36% |
| Representation: Innovation | |||||||
| Net Returns Since Inception (Oct. 31, 2014) | |||||||
| ARKK NAV | -10.45% | 35.58% | 35.58% | 35.02% | -9.00% | 15.01% | 13.60% |
| ARKK Market Price | -10.87% | 35.49% | 35.49% | 34.96% | -9.02% | 14.98% | 13.58% |
ARK selected a single fund manager as the consistent brand to represent the broad US market, international developed markets, and emerging markets respectively so as not to imply ARK conducted due diligence among several or many fund managers. ARK selected Blackrock, and their brand iShares specifically because iShares is one of the largest, most respected, and most trusted passive ETF providers globally that historically offers low tracking error to target exposure, has low fees relative to the industry, and has high liquidity given their scale. This research and report is a hypothetical experiment conducted to understand if an innovation strategy, as represented by the ARK Innovation ETF (ARKK), is value accretive in a total equity portfolio when rebalancing around target weights, as opposed to a temporal rebalancing schedule.
For informational purposes only and should not be considered investment advice, or a recommendation to buy, sell or hold any particular security. Past performance does not guarantee future results. The performance data quoted represents past performance and current returns may be lower or higher. The investment return and principal will fluctuate so that an investor's shares when redeemed may be worth more or less than the original cost. For the Fund’s most recent month end performance, please visit www.ark-funds.com or call 212.426.7040. Returns for less than one year are not annualized. As stated in the ARK ETFs' current prospectuses, the expense ratio for ARKK is 0.75%.
Extraordinary performance is attributable in part due to unusually favorable market conditions and may not be repeated or consistently achieved in the future.
For the most recent month end performance for ITOT, EEM, and EFA visit www.ishares.com or call 1-800-474-2737
Additional information about fees and expense levels can be found in the ARK ETFs' prospectuses. Net asset value (“NAV”) returns are based on the dollar value of a single share of an ARK ETF, calculated using the value of the underlying assets of the ARK ETF minus its liabilities, divided by the number of shares outstanding. The NAV is typically calculated at 4:00 pm Eastern time. Market returns are based on the trade price at which shares are bought and sold on the exchange using the last share trade. Market performance does not represent the returns you would receive if you traded shares at other times. Total Return reflects reinvestment of distributions on ex-date for NAV returns and payment date for Market Price returns. The market price of ARK ETF shares may differ significantly from their NAV during periods of market volatility. ARK's actively managed ETFs are benchmark agnostic. Index performance provided as a general market indicator.
Source: ARK Investment Management LLC. Data Source: Bloomberg. Note following market representations: US Market: iShares Core S&P Total US Stock Market ETF (ITOT; Fee: 0.03%); International Developed Market (Ex US) : iShares MSCI EAFE ETF (EFA; Fee: 0.32%); Emerging Markets: iShares MSCI Emerging Markets ETF (EEM; Fee: 0.70%); Innovation: ARK Innovation ETF (ARKK; Fee: 0.75%, Inception Oct. 30, 2014).
Innovation Could Improve Long-Term Results Without Adding Excess Risk
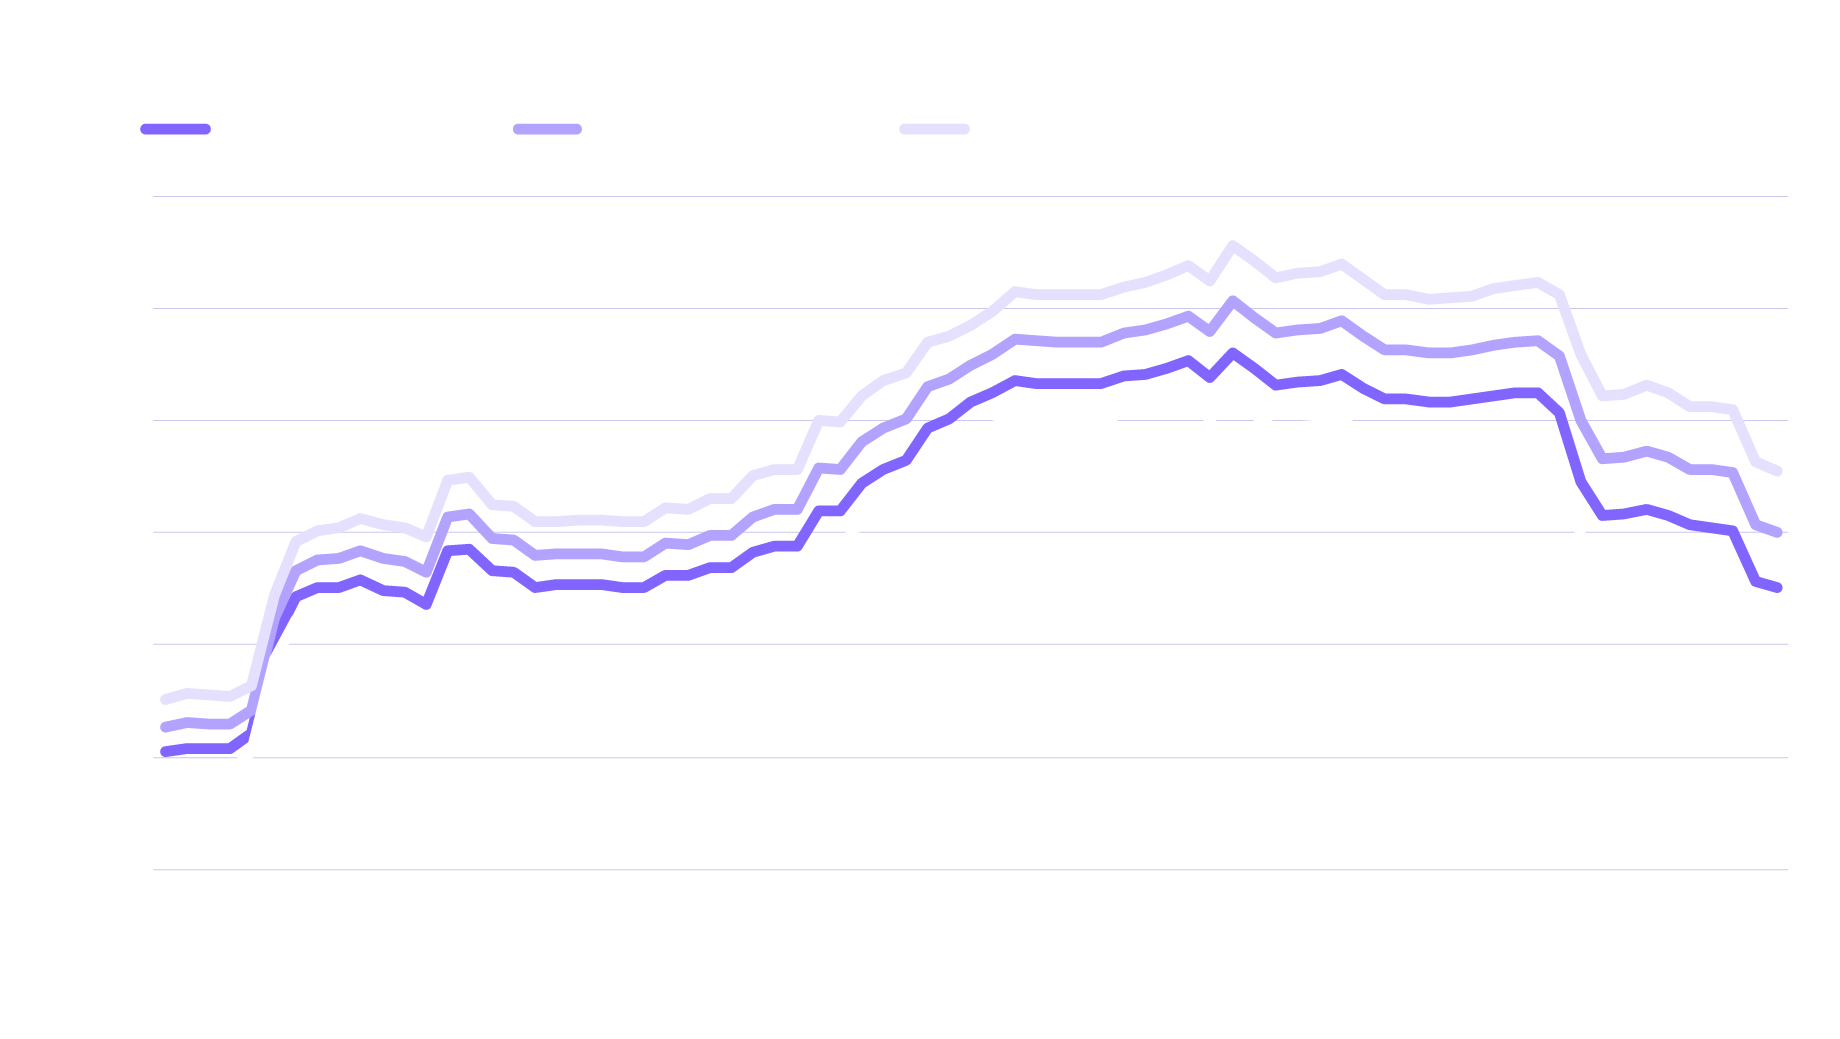
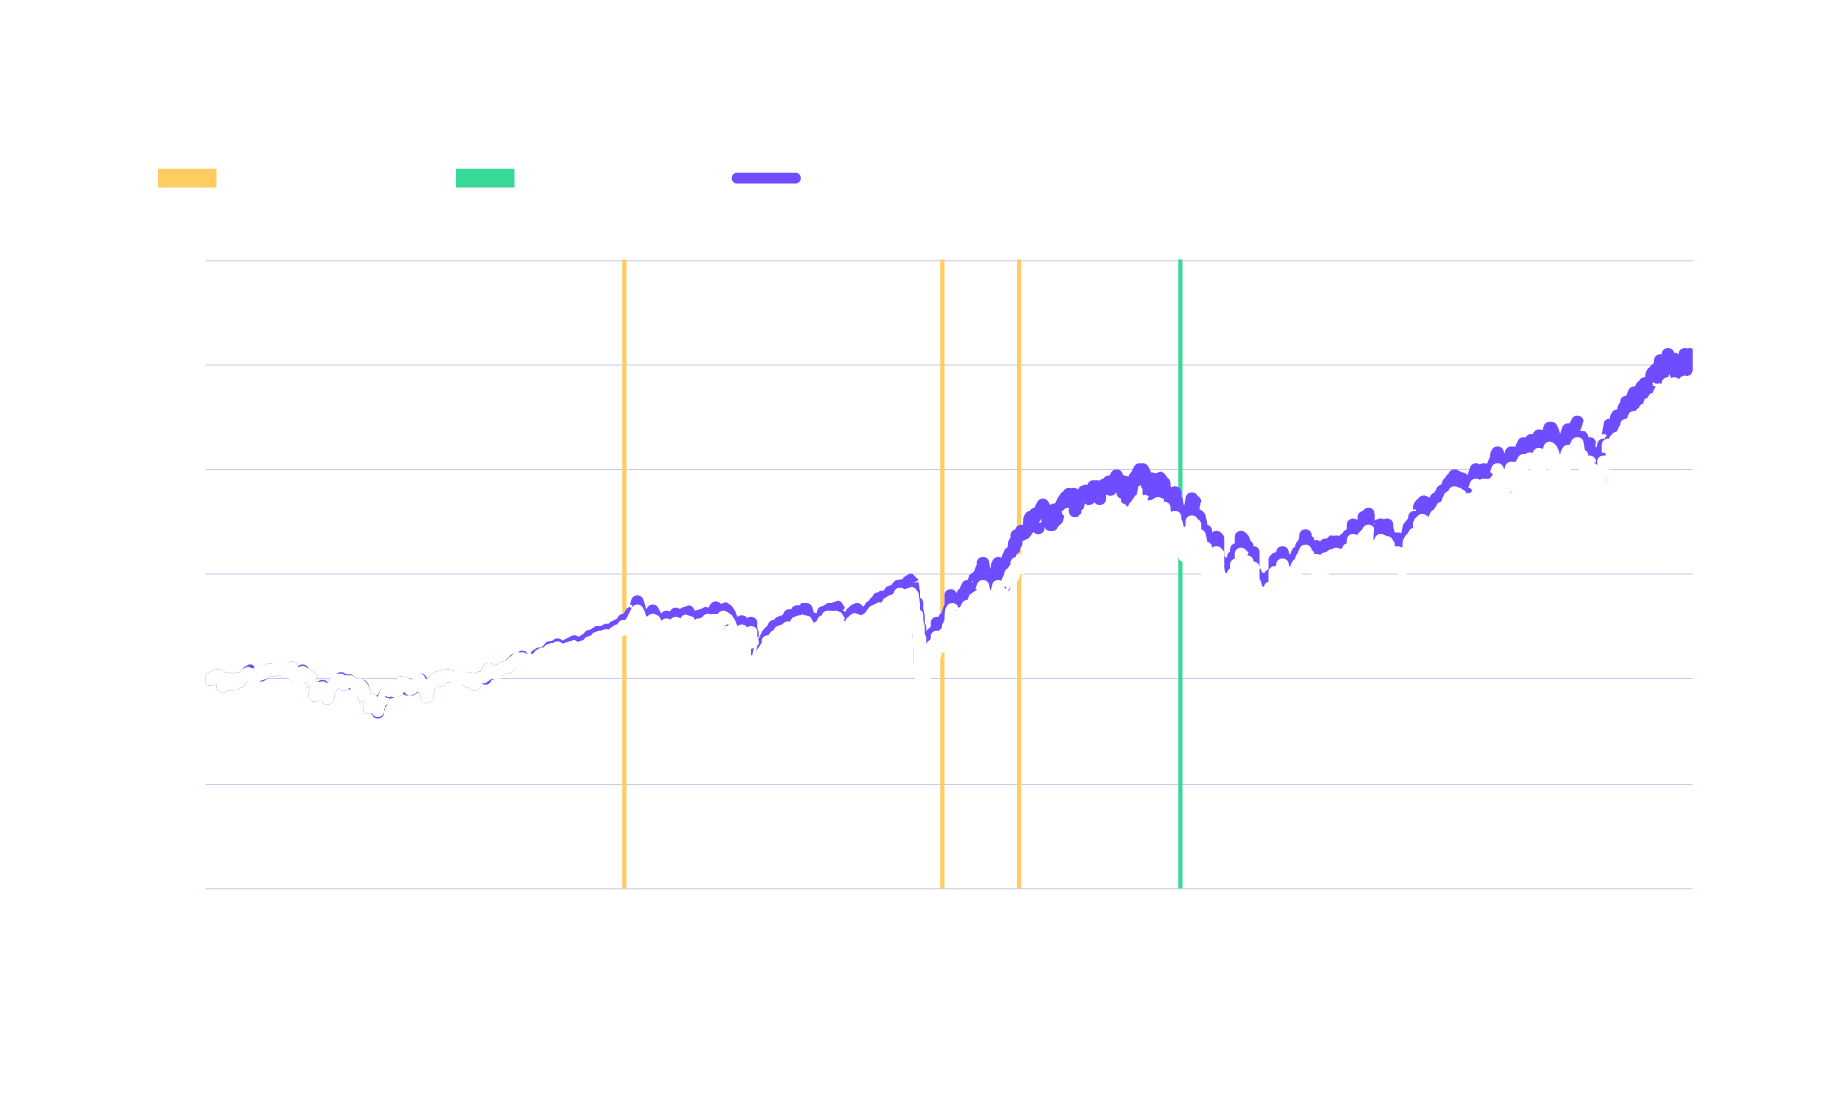
Using rolling five-year periods helps to smooth short-term volatility and aligns with ARK’s long-term investment horizon. Across five-year periods ending within the period between October 31, 2019, through December 31, 2025, portfolios with a 5% innovation allocation outperformed a traditional reference portfolio in the majority of periods studied, as shown below.
For informational purposes only and should not be considered investment advice, or a recommendation to buy, sell or hold any particular security. Past performance does not guarantee future results. Data presented is unreconciled and from a third-party system. hypothetical model portfolios performance returns presented: 1) are not actual portfolios, 2) are being provided for illustrative purposes only, 3) do not represent the results of actual trading, 4) were achieved by means of the retroactive application of the model (see Disclosure at the end) designed with the benefit of hindsight, 5) involves an analytical model (See Disclosure in the back) which uses historical financial data, 6) should not be used as the basis for making an investment decision, 7) are NOT intended to illustrate investment results that were actually achieved or could have been achieved by any of our clients, 8) are comprised of what we believe are the most appropriate securities making up the model portfolios, 9) do not account for typical fees and expenses incurred by our clients, 10) assumes investment in the model portfolios each underlying fund's expense ratio, and 11) do not reflect the impact that material economic and market factors may have had on investment decisions that would have been in actual portfolios being managed at the time and do not involve market risk.
Source: ARK Investment Management LLC. As of December 31, 2025. Data Source: Bloomberg. Note following market representations: Domestic Equity: iShares Core S&P Total US Stock Market ETF (ITOT; Expense Ratio: 0.03%); International Equity (Ex US & Canada): iShares MSCI EAFE ETF (EFA; Expense Ratio: 0.32%); Emerging Markets: iShares MSCI Emerging Markets ETF (EEM; Expense Ratio: 0.70%); Innovation: ARK Innovation ETF (ARKK; Expense Ratio: 0.75%, Inception Oct. 30, 2014).
Some dates in the table may appear to not be month end, due to the end of the month being on a weekend.
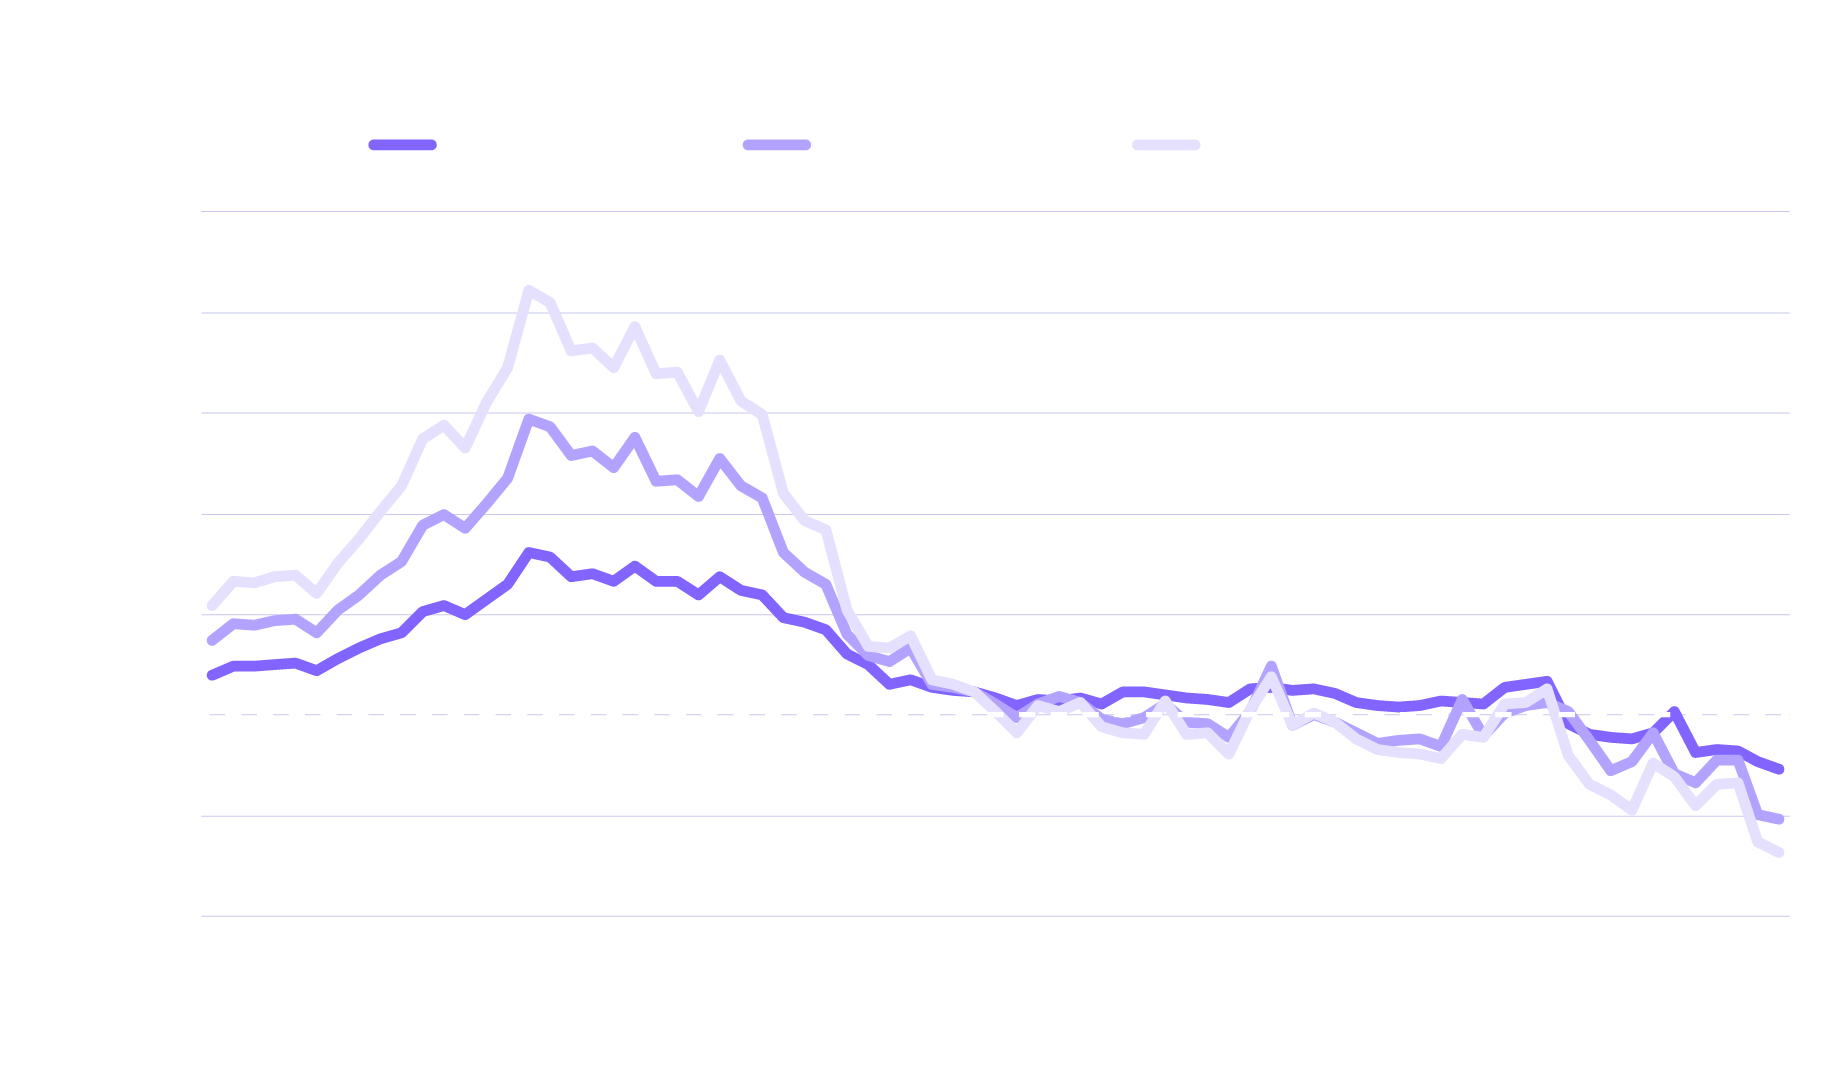
Equally important, adding innovation did not meaningfully increase portfolio risk. Even during the sharp growth stock drawdown from February 2021 through December 2022, which we believe was driven by a steep increase in interest rates, portfolios with an innovation sleeve experienced only modest increases in volatility compared with portfolios without innovation exposure.
For informational purposes only and should not be considered investment advice, or a recommendation to buy, sell or hold any particular security. Past performance does not guarantee future results. Data presented is unreconciled and from a third-party system. The hypothetical model portfolios performance returns presented: 1) are not actual portfolios, 2) are being provided for illustrative purposes only, 3) do not represent the results of actual trading, 4) were achieved by means of the retroactive application of the model (see Disclosure at the end) designed with the benefit of hindsight, 5) involves an analytical model (See Disclosure in the back) which uses historical financial data, 6) should not be used as the basis for making an investment decision, 7) are NOT intended to illustrate investment results that were actually achieved or could have been achieved by any of our clients, 8) are comprised of what we believe are the most appropriate securities making up the model portfolios, 9) do not account for typical fees and expenses incurred by our clients, 10) assumes investment in the model portfolios each underlying fund's expense ratio, and 11) do not reflect the impact that material economic and market factors may have had on investment decisions that would have been in actual portfolios being managed at the time and do not involve market risk.
Source: ARK Investment Management LLC. As of December 31, 2025. Data Source: Bloomberg. Note following market representations: Domestic Equity: iShares Core S&P Total US Stock Market ETF (ITOT; Expense Ratio: 0.03%); International Equity (Ex US & Canada): iShares MSCI EAFE ETF (EFA; Expense Ratio: 0.32%); Emerging Markets: iShares MSCI Emerging Markets ETF (EEM; Expense Ratio: 0.70%); Innovation: ARK Innovation ETF (ARKK; Expense Ratio: 0.75%, Inception Oct. 30, 2014).
Many investors might be surprised that the increase in volatility is relatively modest. But that is what can happen when we follow the rebalancing best practices described above. That said, for clients who want to lower their volatility even more while also accessing innovation, we note that ARK recently launched its Defined Innovation Exposure Term (“DIET”) suite. These ETFs are designed to give investors exposure to ARK’s innovation strategy with built-in, limited downside protection and a limit on the upside they keep. We designed the DIET suite for investors with a different set of risk tolerances and objectives relative to ARK’s core investment strategy.
Why Rebalancing Matters
Behavior is one of the biggest challenges investors face: when innovation underperforms, allocations often shrink; when it performs well, investors are tempted to chase returns. Our research suggests that systematic rebalancing—adding to innovation after drawdowns and trimming after strong performance—historically has improved long-term outcomes. This approach helps investors:
- Avoid buying high and selling low
- Maintain exposure to long-term growth
- Use volatility as an opportunity rather than as a risk
For informational purposes only and should not be considered investment advice, or a recommendation to buy, sell or hold any particular security. Past performance does not guarantee future results. Data presented is unreconciled and from a third-party system. The hypothetical model portfolio’s performance returns presented: 1) are not an actual portfolio, 2) are being provided for illustrative purposes only, 3) do not represent the results of actual trading, 4) were achieved by means of the retroactive application of the model (see Disclosure at the end) designed with the benefit of hindsight, 5) involves an analytical model (See Disclosure in the back) which uses historical financial data, 6) should not be used as the basis for making an investment decision, 7) are NOT intended to illustrate investment results that were actually achieved or could have been achieved by any of our clients, 8) are comprised of what we believe are the most appropriate securities making up the model portfolios, 9) do not account for typical fees and expenses incurred by our clients, 10) assumes investment in the model portfolios net of each underlying fund's expense ratio, and 11) do not reflect the impact that material economic and market factors may have had on investment decisions that would have been in actual portfolios being managed at the time and do not involve market risk.
Source: ARK Investment Management LLC. As of December 31, 2025. Data Source: Bloomberg. Note following market representations: Domestic Equity Market: iShares Core S&P Total US Stock Market ETF (ITOT; Expense Ratio: 0.03%); International Equity Market (Ex US & Canada) : iShares MSCI EAFE ETF (EFA; Expense Ratio: 0.32%); Emerging Markets: iShares MSCI Emerging Markets ETF (EEM; Expense Ratio: 0.70%); Innovation: ARK Innovation ETF (ARKK; Expense Ratio: 0.75%, Inception Oct. 30, 2014).
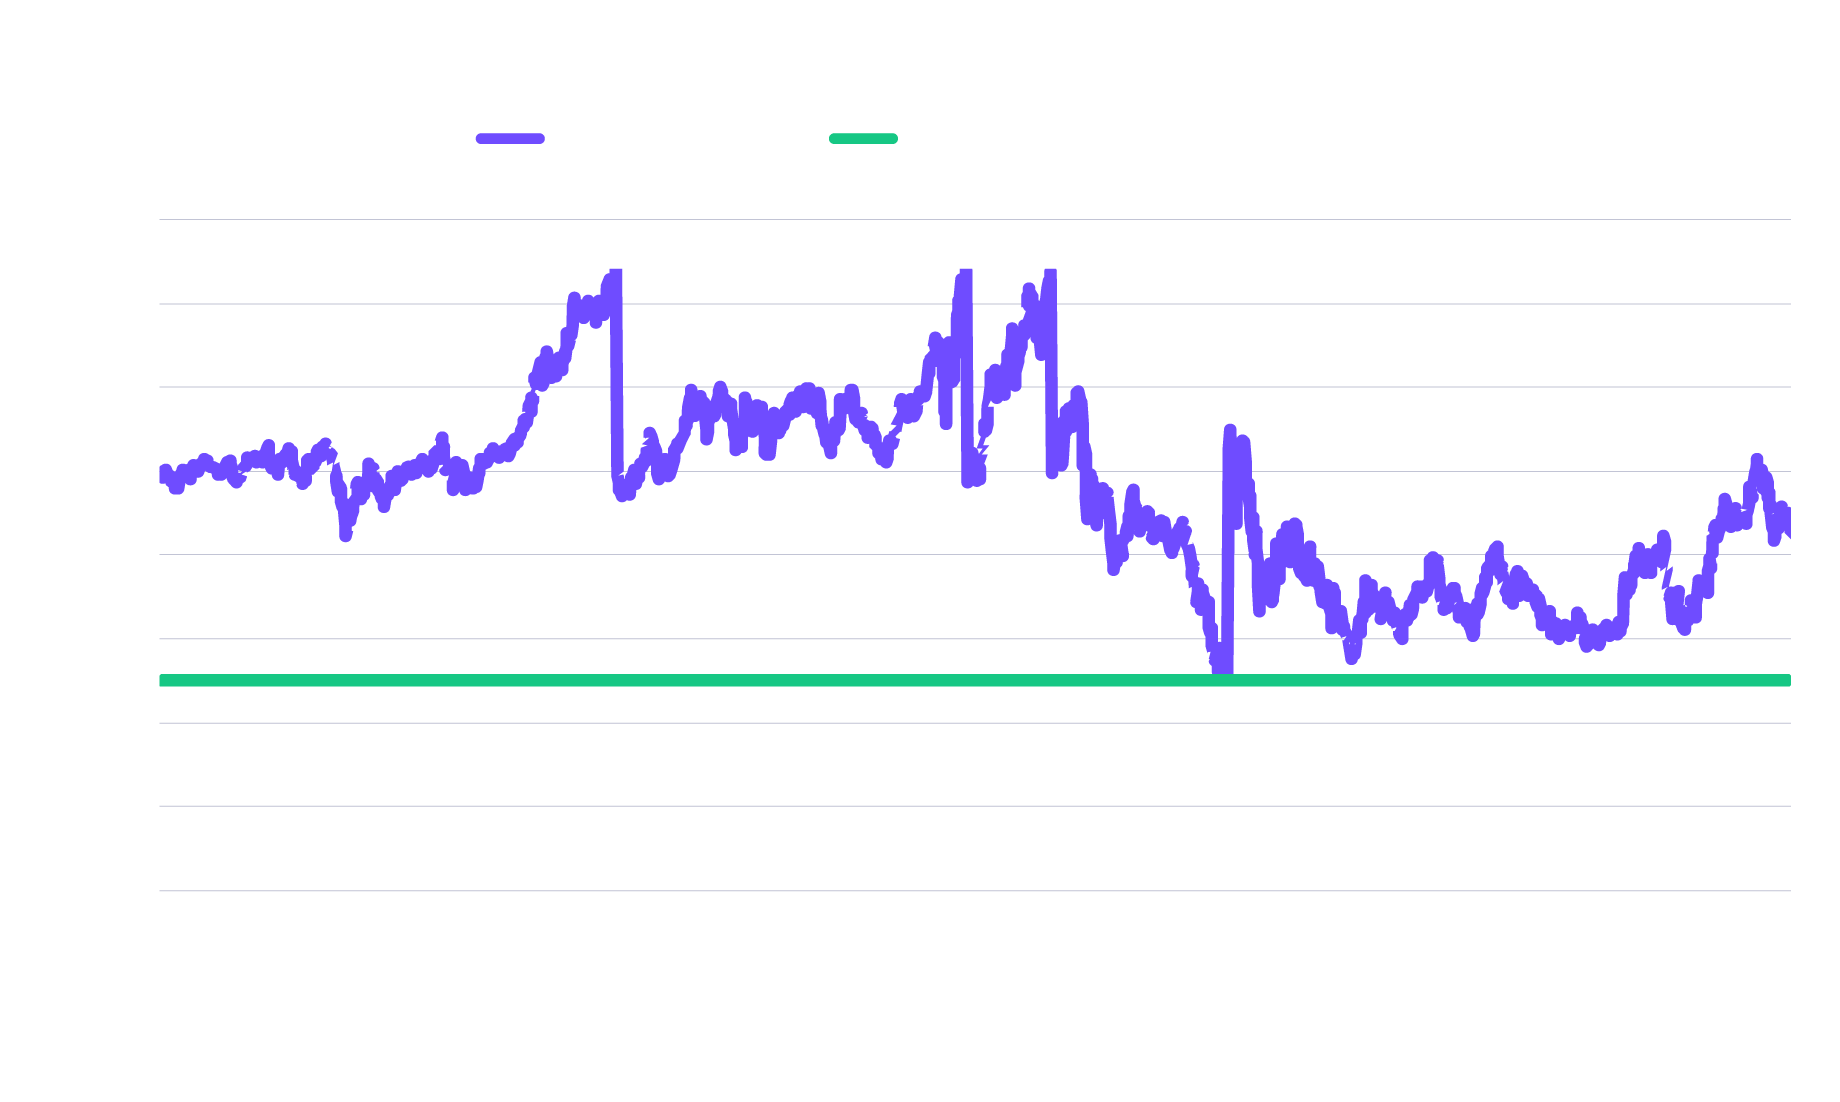
Weight To Innovation: 5% Target With 2.5% Rebalancing Band
Notably, despite ARKK’s strong performance in 2025, the modeled 5% innovation portfolio ended the year with a 4.3% weight, below its target. In other words, innovation may still be earlier in the allocation cycle than many investors realize. At the same time, many investors have no innovation exposure at all, which we believe represents a meaningful gap, if not risk.
Source: ARK Investment Management LLC, 2025, based on data from Bloomberg as of June 30, 2025. Note: Domestic Equity: iShares Core S&P Total US Stock Market ETF (ITOT; Expense Ratio: 0.03%); International Equity (Ex US & Canada): iShares MSCI EAFE ETF (EFA; Expense Ratio: 0.32%); Emerging Markets: iShares MSCI Emerging Markets ETF (EEM; Expense Ratio: 0.70%); Innovation: ARK Innovation ETF (ARKK; Expense Ratio: 0.75%, Inception Oct. 30, 2014).
For informational purposes only and should not be considered investment advice, or a recommendation to buy, sell or hold any particular security. Past performance does not guarantee future results. The Global Equity Portfolio scenarios shown are hypothetical and based on model portfolios constructed by ARK and form the basis of the hypothetical performance calculations shown on the following slides. Each asset class is represented by an ETF as described below.
Why Many Portfolios Are Still Underexposed
Despite innovation’s improving performance, we believe many portfolios remain under allocated for three reasons:
- Backward-looking benchmarks tend to emphasize mature industries over emerging technologies
- Short-term narratives distract from long-term value creation
- Behavioral decisions often reduce exposure during periods of volatility
As ARK Invest CEO and CIO Cathie Wood has noted, markets often struggle to price exponential growth. Progress can compound quietly, until it suddenly becomes visible.
Looking Ahead In 2026
As we move into 2026, several trends are poised to support innovation:
- Interest rates have stabilized, with the potential for further cuts in the Fed Funds rate
- AI is moving from experimentation to real-world deployment
- Healthcare innovation is accelerating as data and computing scale
- Financial systems continue to modernize through digital networks
Together, these forces suggest that innovation is not a niche theme; it is central to future growth.
For investors seeking thoughtful exposure, ARK offers actively managed ETFs focused on what we believe are the most transformative innovation platforms: artificial intelligence, robotics, energy storage, multiomics, and blockchain technology.
We encourage investors to work with financial professionals to evaluate whether a dedicated innovation allocation can improve long-term diversification and growth.
- ARK Innovation ETF (ARKK) provides broad exposure across the key platforms noted above, capturing convergence across sectors.
- ARK Next Generation Internet ETF (ARKW) emphasizes the evolution of the internet through AI, blockchain, and cloud computing, including the crypto ecosystem.
- ARK Autonomous Technology & Robotics ETF (ARKQ) focuses on automation, mobility, and next-gen intelligent machines.
- ARK Genomic Revolution ETF (ARKG) targets breakthroughs in mutliomics sequencing, diagnostics, and precision medicine.
- ARK Fintech Innovation ETF (ARKF) invests in technologies transforming the future of finance, from digital wallets to AI-driven risk analysis.
- ARK Space & Defense Innovation ETF (ARKX) captures opportunities in aerospace, satellite technologies, and industries transformed by space innovation—including defense, communications, GPS, agriculture, and imaging.
Important Information
Investors should carefully consider the investment objectives and risks as well as charges and expenses of an ARK Fund before investing. This and other information are contained in the ARK ETFs’ prospectuses and summary prospectuses, which may be obtained by visiting www.ark-funds.com. The prospectus and summary prospectus should be read carefully before investing.
The S&P 500® Index is a widely recognized capitalization-weighted index that measures the performance of the large-capitalization sector of the U.S. stock market. The MSCI World Index represents large and mid-cap equity performance across 23 developed markets countries. The NASDAQ-100 Index is a stock market index that includes 100 of the largest, most actively traded, non-financial companies that are listed on the Nasdaq Stock Market. The Nasdaq Composite Index is the market capitalization-weighted index of over 3,300 common equities listed on the Nasdaq stock exchange. The types of securities in the index include American depositary receipts, common stocks, real estate investment trusts (REITs) and tracking stocks, as well as limited partnership interests. The index includes all Nasdaq-listed stocks that are not derivatives, preferred shares, funds, exchange-traded funds (ETFs) or debenture securities. You cannot invest directly in an index and securities in an ETF will not match those in an index. The active ETFs are benchmark agnostic and corresponding portfolios may have significant non-correlation to any index. Index returns are generally provided as an overall market indicator.
Active Share is a metric that quantifies how different a fund's holdings are from its benchmark index.
An investment in an ARK Fund is subject to risks and you can lose money on your investment in an ARK Fund. There can be no assurance that the ARK Funds will achieve their investment objectives. The ARK Funds’ portfolios are more volatile than broad market averages. The ARK Funds also have specific risks, which are described below. More detailed information regarding these risks can be found in the ARK Funds’ prospectuses.
The principal risks of investing in the ARK Funds include:
Disruptive Innovation Risk. Companies that ARK believes are capitalizing on disruptive innovation and developing technologies to displace older technologies or create new markets may not in fact do so. Companies that initially develop a novel technology may not be able to capitalize on the technology. Companies that develop disruptive technologies may face political or legal attacks from competitors, industry groups or local and national governments. These companies may also be exposed to risks applicable to sectors other than the disruptive innovation theme for which they are chosen, and the securities issued by these companies may underperform the securities of other companies that are primarily focused on a particular theme.
Equity Securities Risk. The value of the equity securities the ARK Funds hold may fall due to general market and economic conditions. Foreign Securities Risk. Investments in the securities of foreign issuers involve risks beyond those associated with investments in U.S. securities. Health Care Sector Risk. The health care sector may be affected by government regulations and government health care programs. Consumer Discretionary Risk. Companies in this sector may be adversely impacted by changes in domestic/international economies, exchange/interest rates, social trends and consumer preferences. Industrials Sector Risk. Companies in the industrials sector may be adversely affected by changes in government regulation, world events, economic conditions, environmental damages, product liability claims and exchange rates. Information Technology Sector Risk. Information technology companies face intense competition, both domestically and internationally, which may have an adverse effect on profit margins.
Financial Technology Risk. Companies that are developing financial technologies that seek to disrupt or displace established financial institutions generally face competition from much larger and more established firms. Fintech Innovation Companies may not be able to capitalize on their disruptive technologies if they face political and/or legal attacks from competitors, industry groups or local and national governments. Blockchain technology is new and many of its uses may be untested. Blockchain and Digital commodities and their associated platforms are largely unregulated, and the regulatory environment is rapidly evolving. As a result, companies engaged in such blockchain activities may be exposed to adverse regulatory action, fraudulent activity or even failure. Communications Sector Risk. Companies is this sector may be adversely affected by potential obsolescence of products/services, pricing competition, research and development costs, substantial capital requirements and government regulation.
Cryptocurrency Risk. Cryptocurrency (notably, bitcoin), often referred to as ‘‘virtual currency’’ or ‘‘digital currency,’’ operates as a decentralized, peer-to-peer financial exchange and value storage that is used like money. Some of the ARK actively managed Funds may have exposure to bitcoin, a cryptocurrency, indirectly through an investment in the ARK 21Shares Bitcoin ETF, a 1933-Act exchange traded product. Cryptocurrency operates without central authority or banks and is not backed by any government. Even indirectly, cryptocurrencies may experience very high volatility and related investment vehicles like ARKB may be affected by such volatility. As a result of holding cryptocurrency, the Fund may also trade at a significant premium to NAV. Cryptocurrency is also not legal tender. Federal, state or foreign governments may restrict the use and exchange of cryptocurrency, and regulation in the U.S. is still developing. Cryptocurrency exchanges may stop operating or permanently shut down due to fraud, technical glitches, hackers or malware. Leverage Risk. The use of leverage can create risks. Leverage can increase market exposure, increase volatility in the Fund, magnify investment risks, and cause losses to be realized more quickly.
Health Care Sector Risk. The health care sector may be adversely affected by government regulations and government health care programs, restrictions on government reimbursements for medical expenses, increases or decreases in the cost of medical products and services and product liability claims, among other factors. Many health care companies are heavily dependent on patent protection and intellectual property rights and the expiration of a patent may adversely affect their profitability.
Biotechnology Company Risk. A biotechnology company’s valuation can often be based largely on the potential or actual performance of a limited number of products and can accordingly be greatly affected if one of its products proves, among other things, unsafe, ineffective or unprofitable. Biotechnology companies are subject to regulation by, and the restrictions of, the U.S. Food and Drug Administration, the U.S. Environmental Protection Agency, state and local governments, and foreign regulatory authorities.
Pharmaceutical Company Risk. Companies in the pharmaceutical industry can be significantly affected by, among other things, government approval of products and services, government regulation and reimbursement rates, product liability claims, patent expirations and protection and intense competition.
Additional risks of investing in ARK ETFs include market, management and non-diversification risks, as well as fluctuations in market value NAV. ETF shares may only be redeemed directly with the ETF at NAV by Authorized Participants, in very large creation units. There can be no guarantee that an active trading market for ETF shares will develop or be maintained, or that their listing will continue or remain unchanged. Buying or selling ETF shares on an exchange may require the payment of brokerage commissions and frequent trading may incur brokerage costs that detract significantly from investment returns.
To view the top ten holdings and standardized performance for ARKK click here.
To view the top ten holdings and standardized performance for ARKQ click here.
To view the top ten holdings and standardized performance for ARKW click here.
To view the top ten holdings and standardized performance for ARKG click here.
To view the top ten holdings and standardized performance for ARKF click here.
To view the top ten holdings and standardized performance for ARKX click here.
ARK Investment Management LLC is the investment adviser to the ARK Funds.
Foreside Fund Services, LLC, distributor.
ARK’s statements are not an endorsement of any company or a recommendation to buy, sell or hold any security. ARK and its clients as well as its related persons may (but do not necessarily) have financial interests in securities or issuers that are discussed. Certain of the statements contained may be statements of future expectations and other forward-looking statements that are based on ARK’s current views and assumptions and involve known and unknown risks and uncertainties that could cause actual results, performance, or events to differ materially from those expressed or implied in such statements.
Explore ARK Funds
Featured Funds:
ARK Innovation ETF
ARK Autonomous Tech. & Robotics ETF
ARK Next Generation Internet ETF
ARK Genomic Revolution ETF
ARK Blockchain & Fintech Innovation ETF
ARK Space & Defense Innovation ETF

ARK Trade Notifications
ARK offers fully transparent Exchange Traded Funds (“ETFs”) and provides investors with trade information for all actively managed ETFs.
