


Executive Summary
In the market commentary we released last week, we hypothesized that the record-breaking concentration into the Magnificent Six1 during the last few years is a precursor either to an equity bear market or to a broader based bull market. We concluded that the latter scenario is more likely, potentially rewarding innovative companies that have been neglected. Important to that conclusion is the economic backdrop, particularly the outlook for inflation and interest rates.
In this piece, we attempt to put the current economic backdrop into perspective, offering evidence that inflation and interest rates are likely to surprise on the low side of expectations. Indeed, we would not be surprised to see many prices fall, not only in response to monetary restraint but also to the technologically enabled disruptive innovation that a more broad-based bull market could unleash.
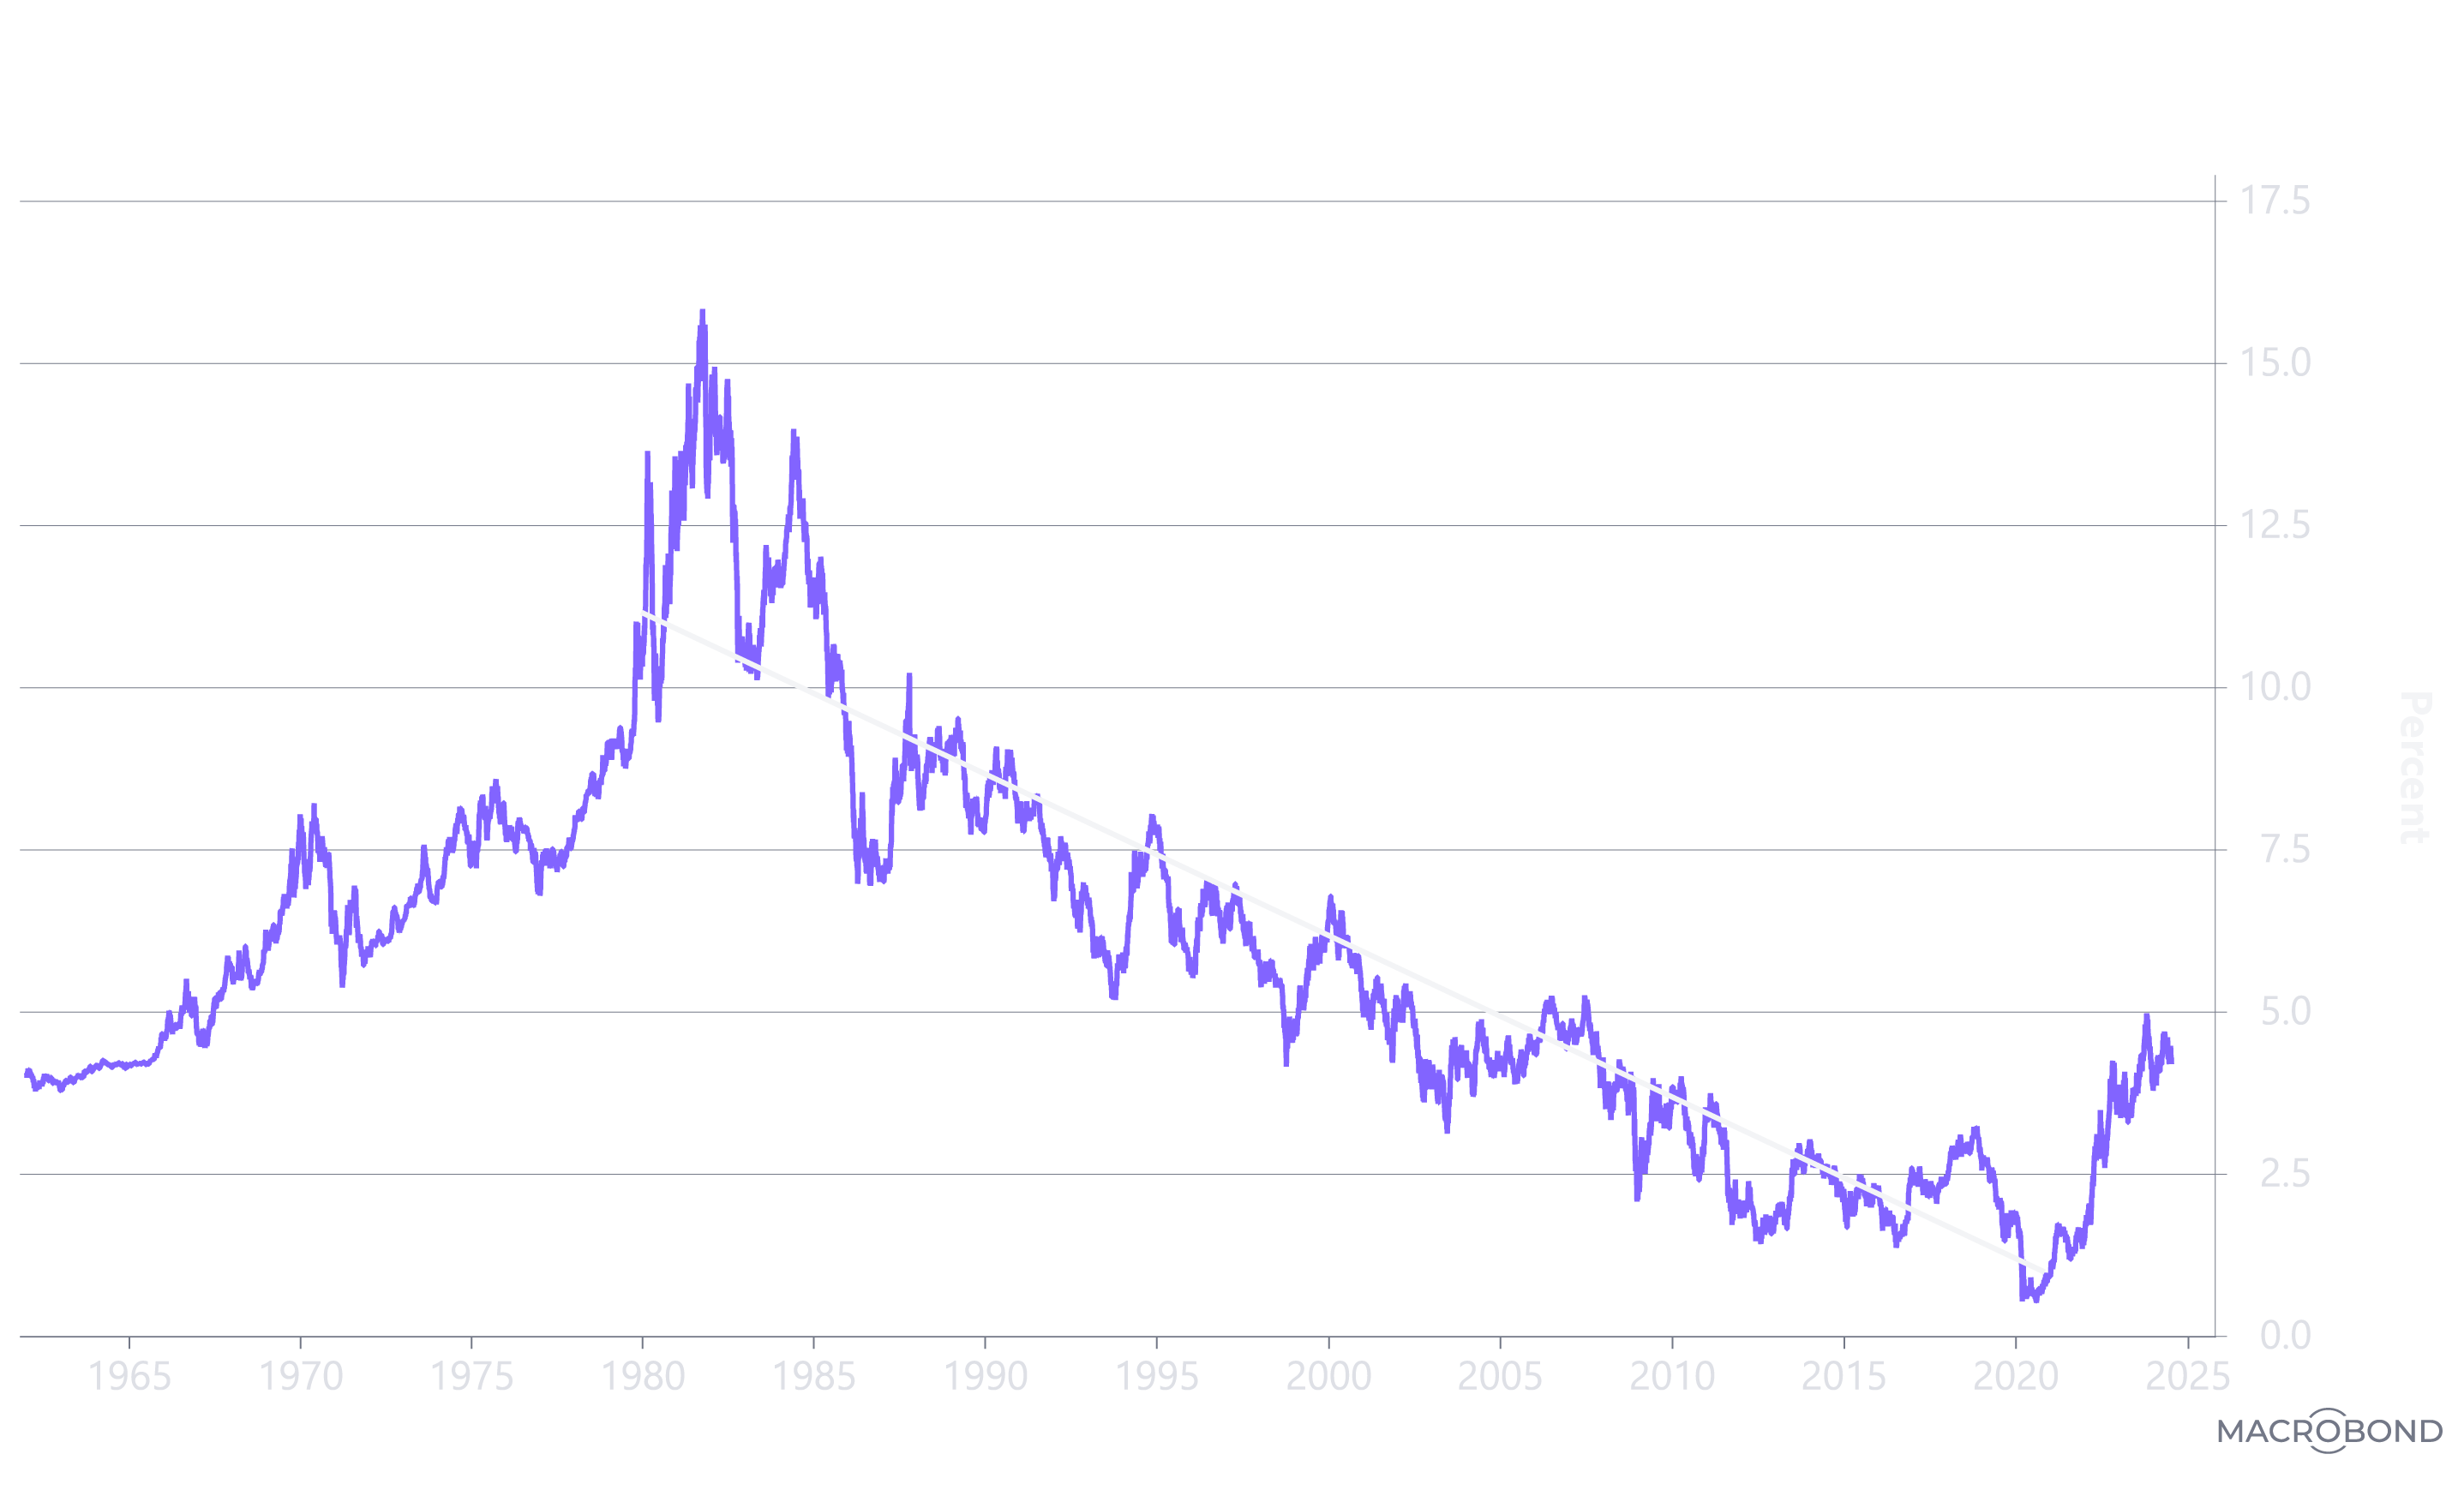
Interest Rate Signals: The U.S. 10-Year Treasury Yield
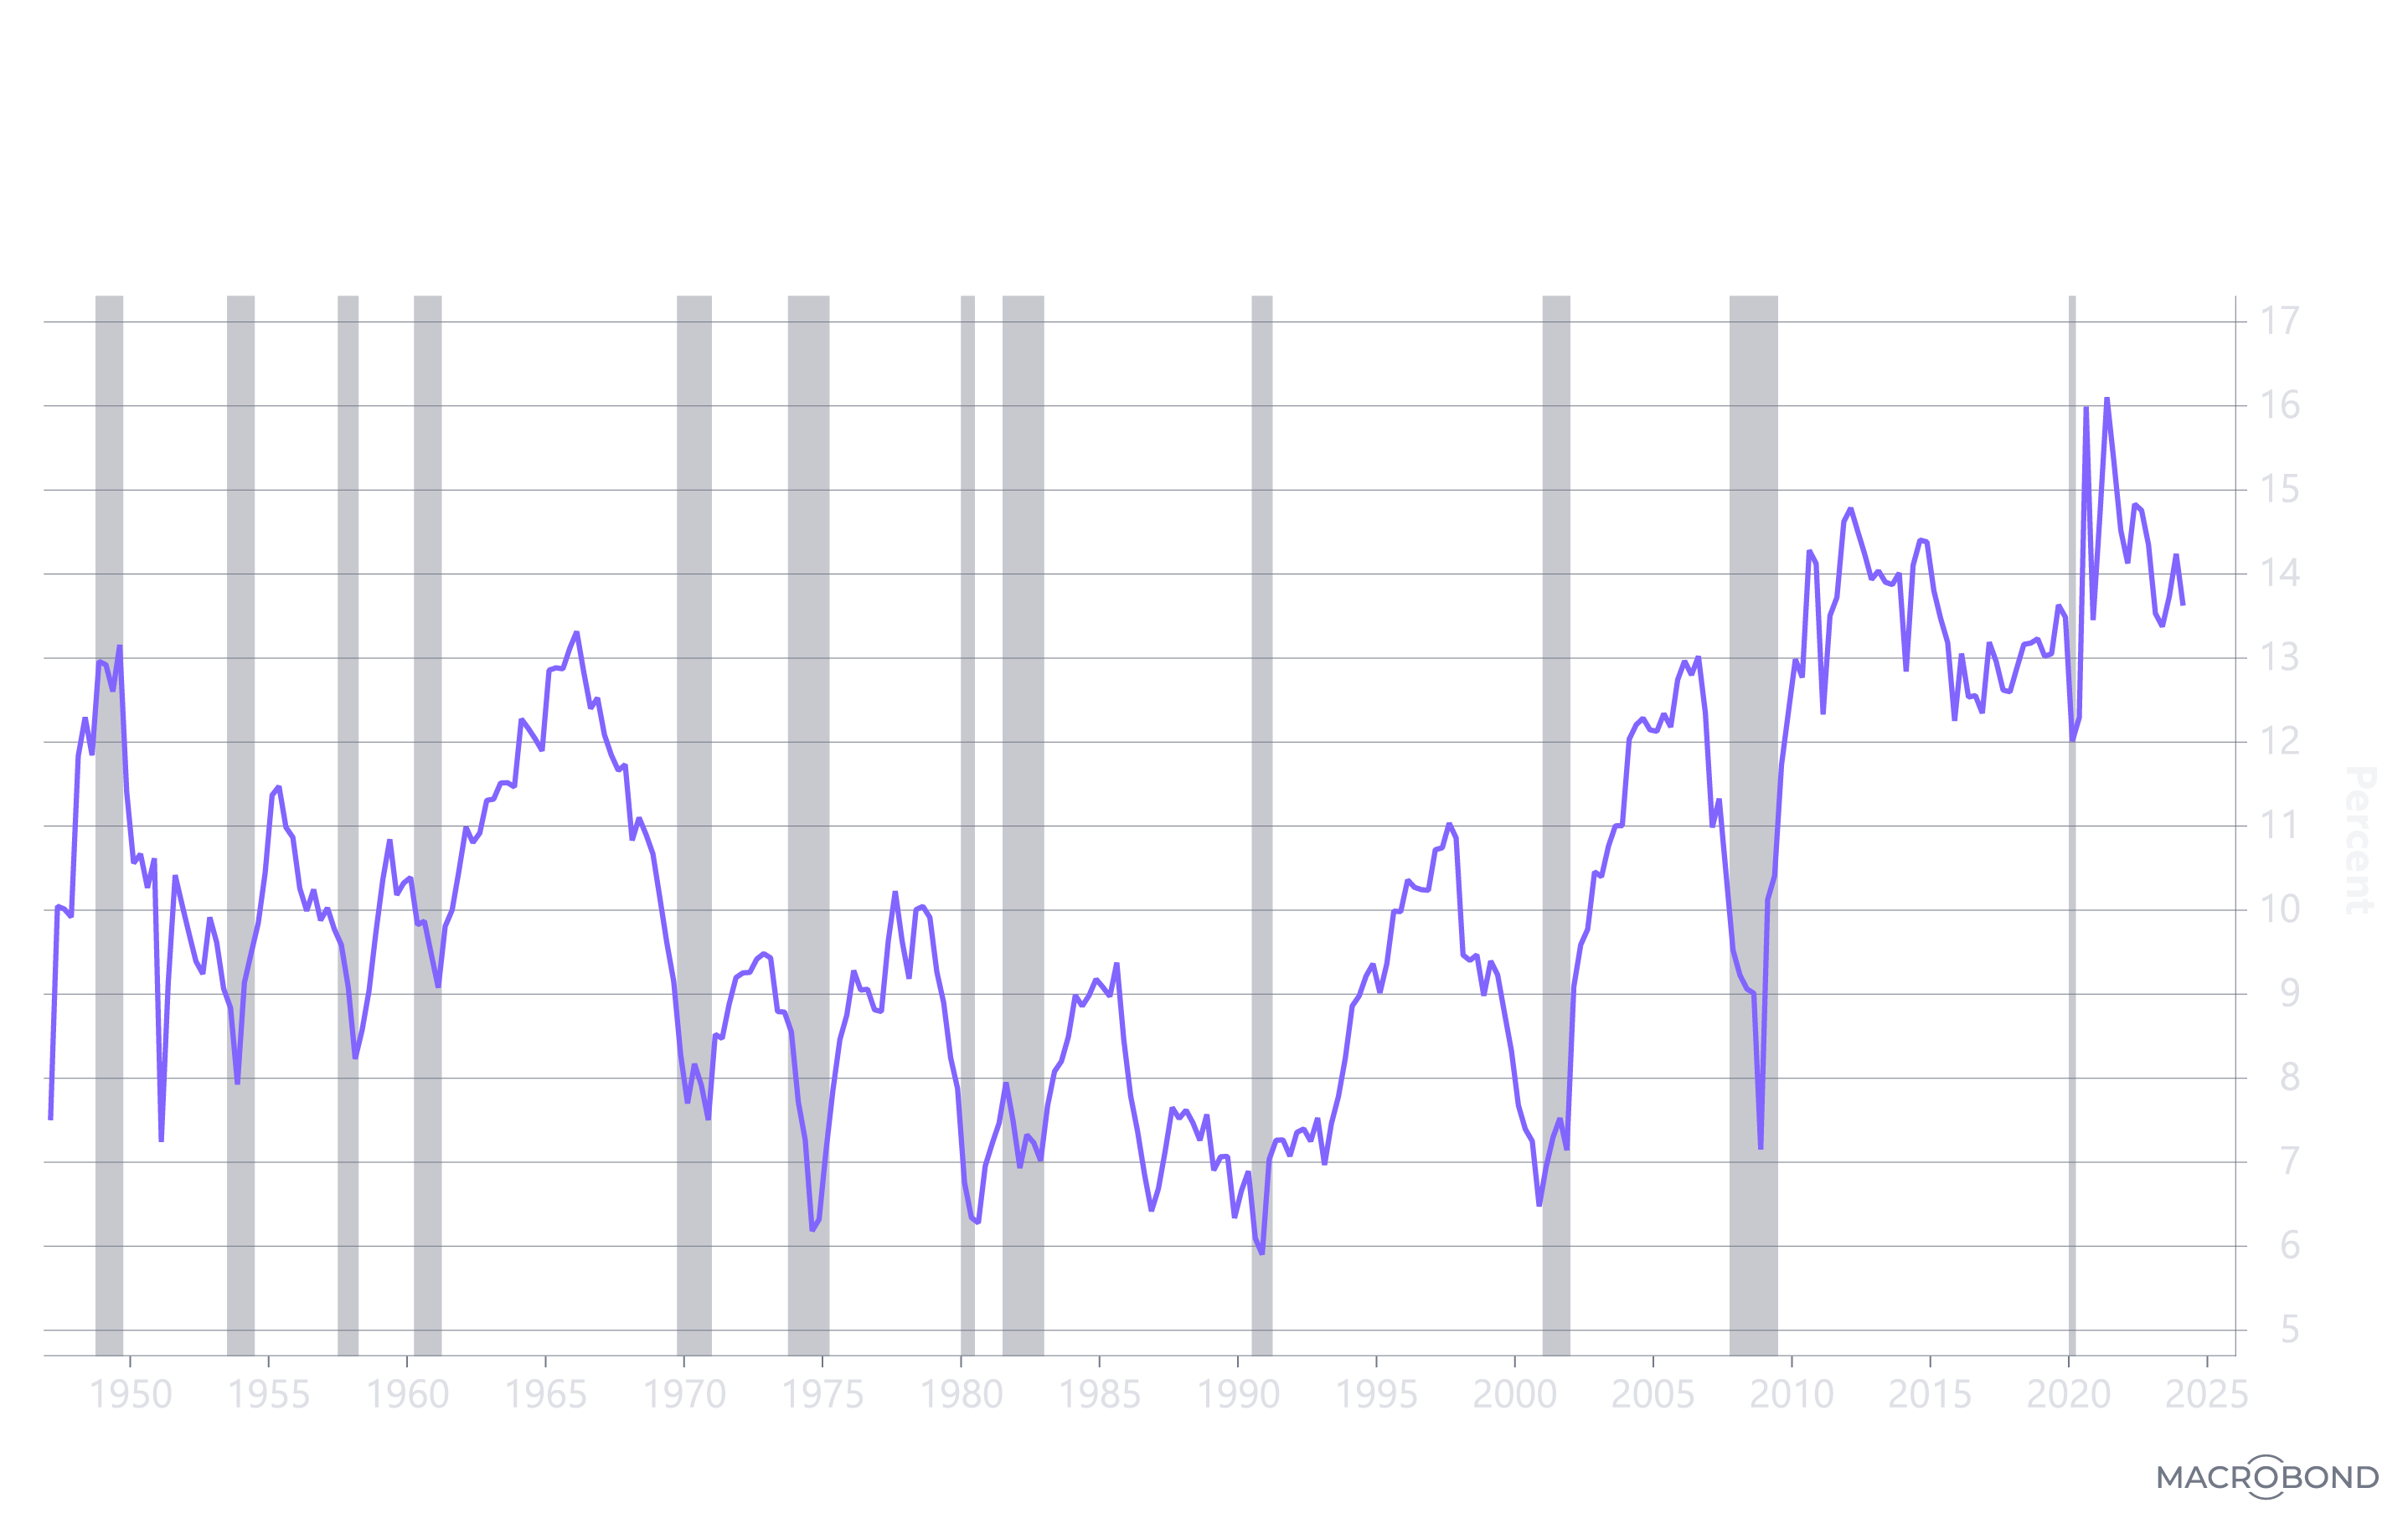
Did this U.S. Federal Reserve (Fed) let the inflation genie out of the bottle for the first time in 40 years? In 1981, as measured by the 10-year Treasury bond yield, interest rates peaked at 15.8% and then trended down for ~40 years as Fed Chairman Paul Volcker and his successors tackled and defeated inflation, as shown below. They bottomed out at 0.5% during the COVID crisis as fiscal and monetary authorities around the world stimulated aggressively and, in hindsight, successfully... some worry, perhaps too successfully.
Source: ARK Investment Management LLC, 2024, based on data from Macrobond as of May 31, 2024. For informational purposes only and should not be considered investment advice or a recommendation to buy, sell, or hold any particular security. Past performance is not indicative of future results.
Overwhelming stimulus has questioned whether the 40-year trend toward di minimis inflation has ended. Importantly, the string of "lower highs" in the long-term Treasury yield stopped at 3% in the fall of 2018. By October 2023, the yield had backed up to 5% for the first time since July 2007.
That said, other signals have been contradicting the notion that the Fed let the inflation genie escape. Among them are commodity prices, interest rate analytics, and equity market concentration, as discussed below.
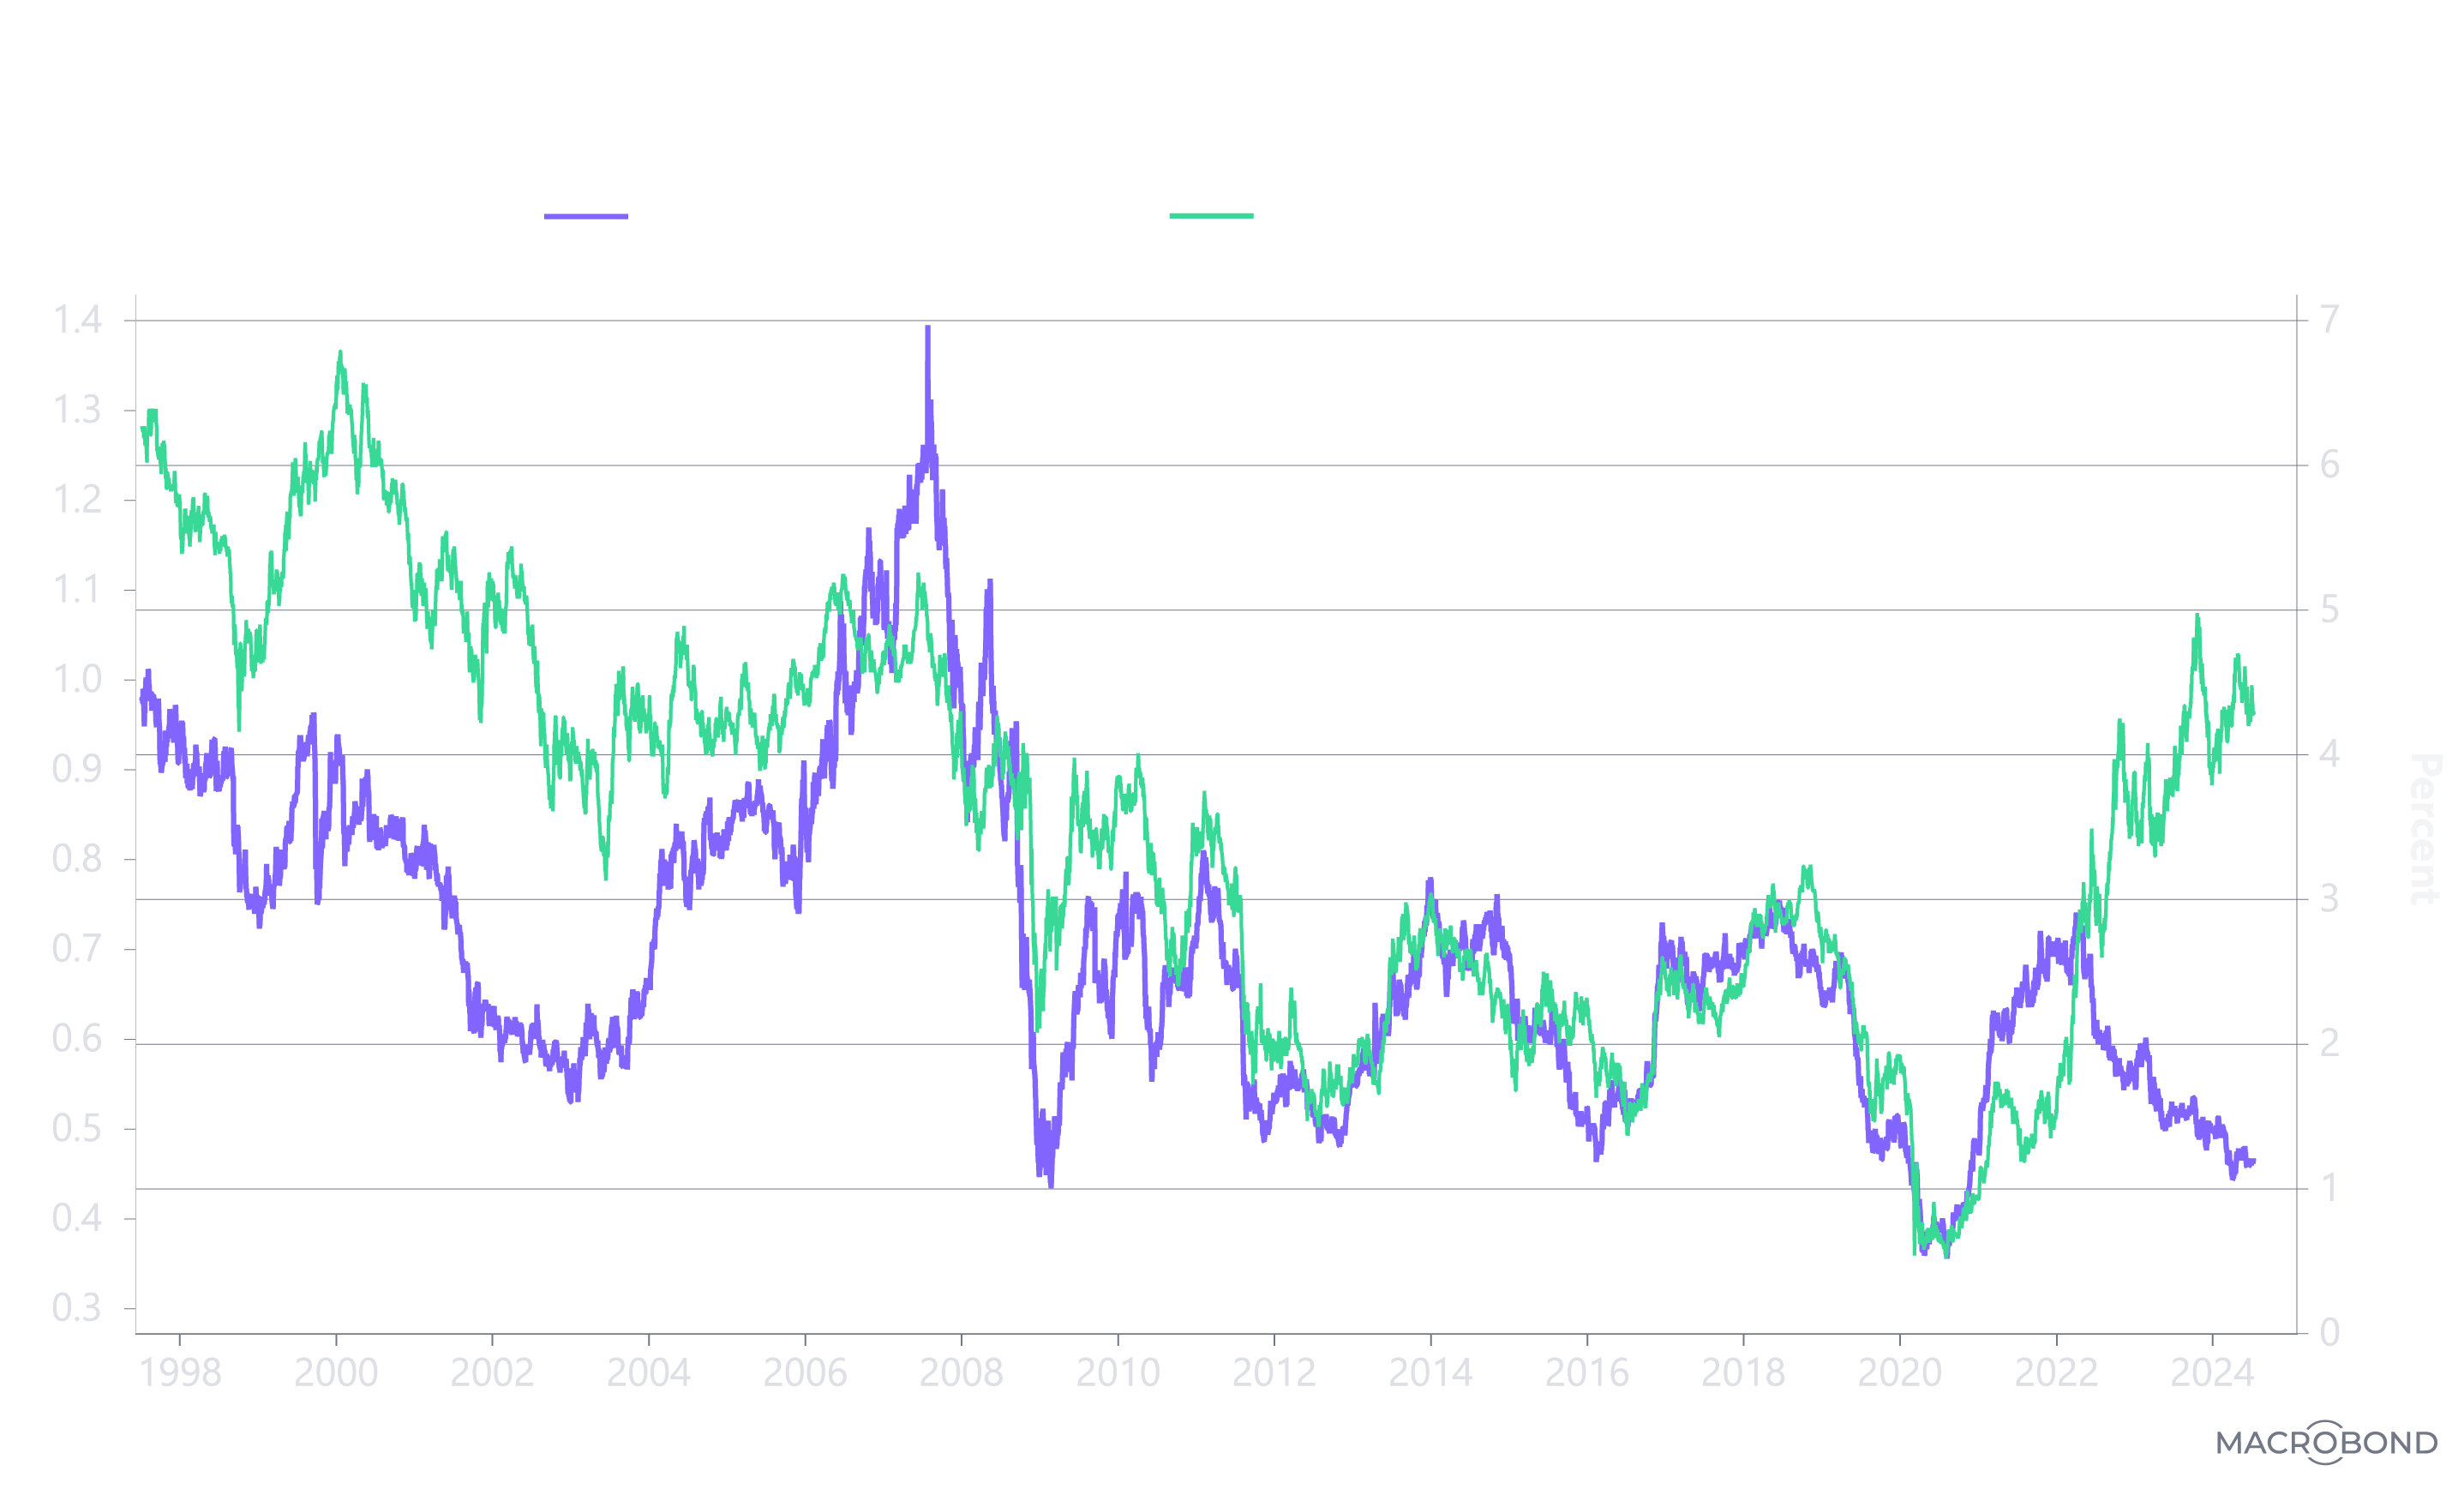
Commodity Price Signals: Metals Relative to Gold
Why are metals2 prices lagging significantly behind the gold price? Since the Global Financial Crisis (GFC), the highly positive correlation3 between the 10-year Treasury bond yield and the metals-to-gold-price ratio has been striking. Interest rates have increased and decreased in tandem with the purchasing power of metals relative to gold. When the purchasing power of metals increased relative to gold, Treasury yields rose, as shown below. When the purchasing power of metals decreased relative to gold, Treasury yields declined...until 2022 when the Fed began to shock the financial markets with a 22-fold increase in its target interest rate, also known as the Fed Funds Target Rate.
Source: ARK Investment Management LLC, 2024, based on data from Macrobond as of May 31, 2024. For informational purposes only and should not be considered investment advice or a recommendation to buy, sell, or hold any particular security or commodity. Past performance is not indicative of future results.
As the Fed Funds Target rate soared from 0.25% in 2022 to 5.5% in little more than a year's time, the correlation between the metals-to-gold price ratio and long-term Treasury yields suddenly turned negative: the long bond yield increased, but the metals-to-gold-price ratio dropped to levels associated with the 2008-09 GFC, the European sovereign debt crisis in 2011-12, fears of a China debt implosion in 2016, and the COVID crisis in 2020. Instead of falling 100-200 basis points4 into the 1-2% range suggested by the once-positive correlation, the 10-year Treasury yield increased 200 basis points to 5%.
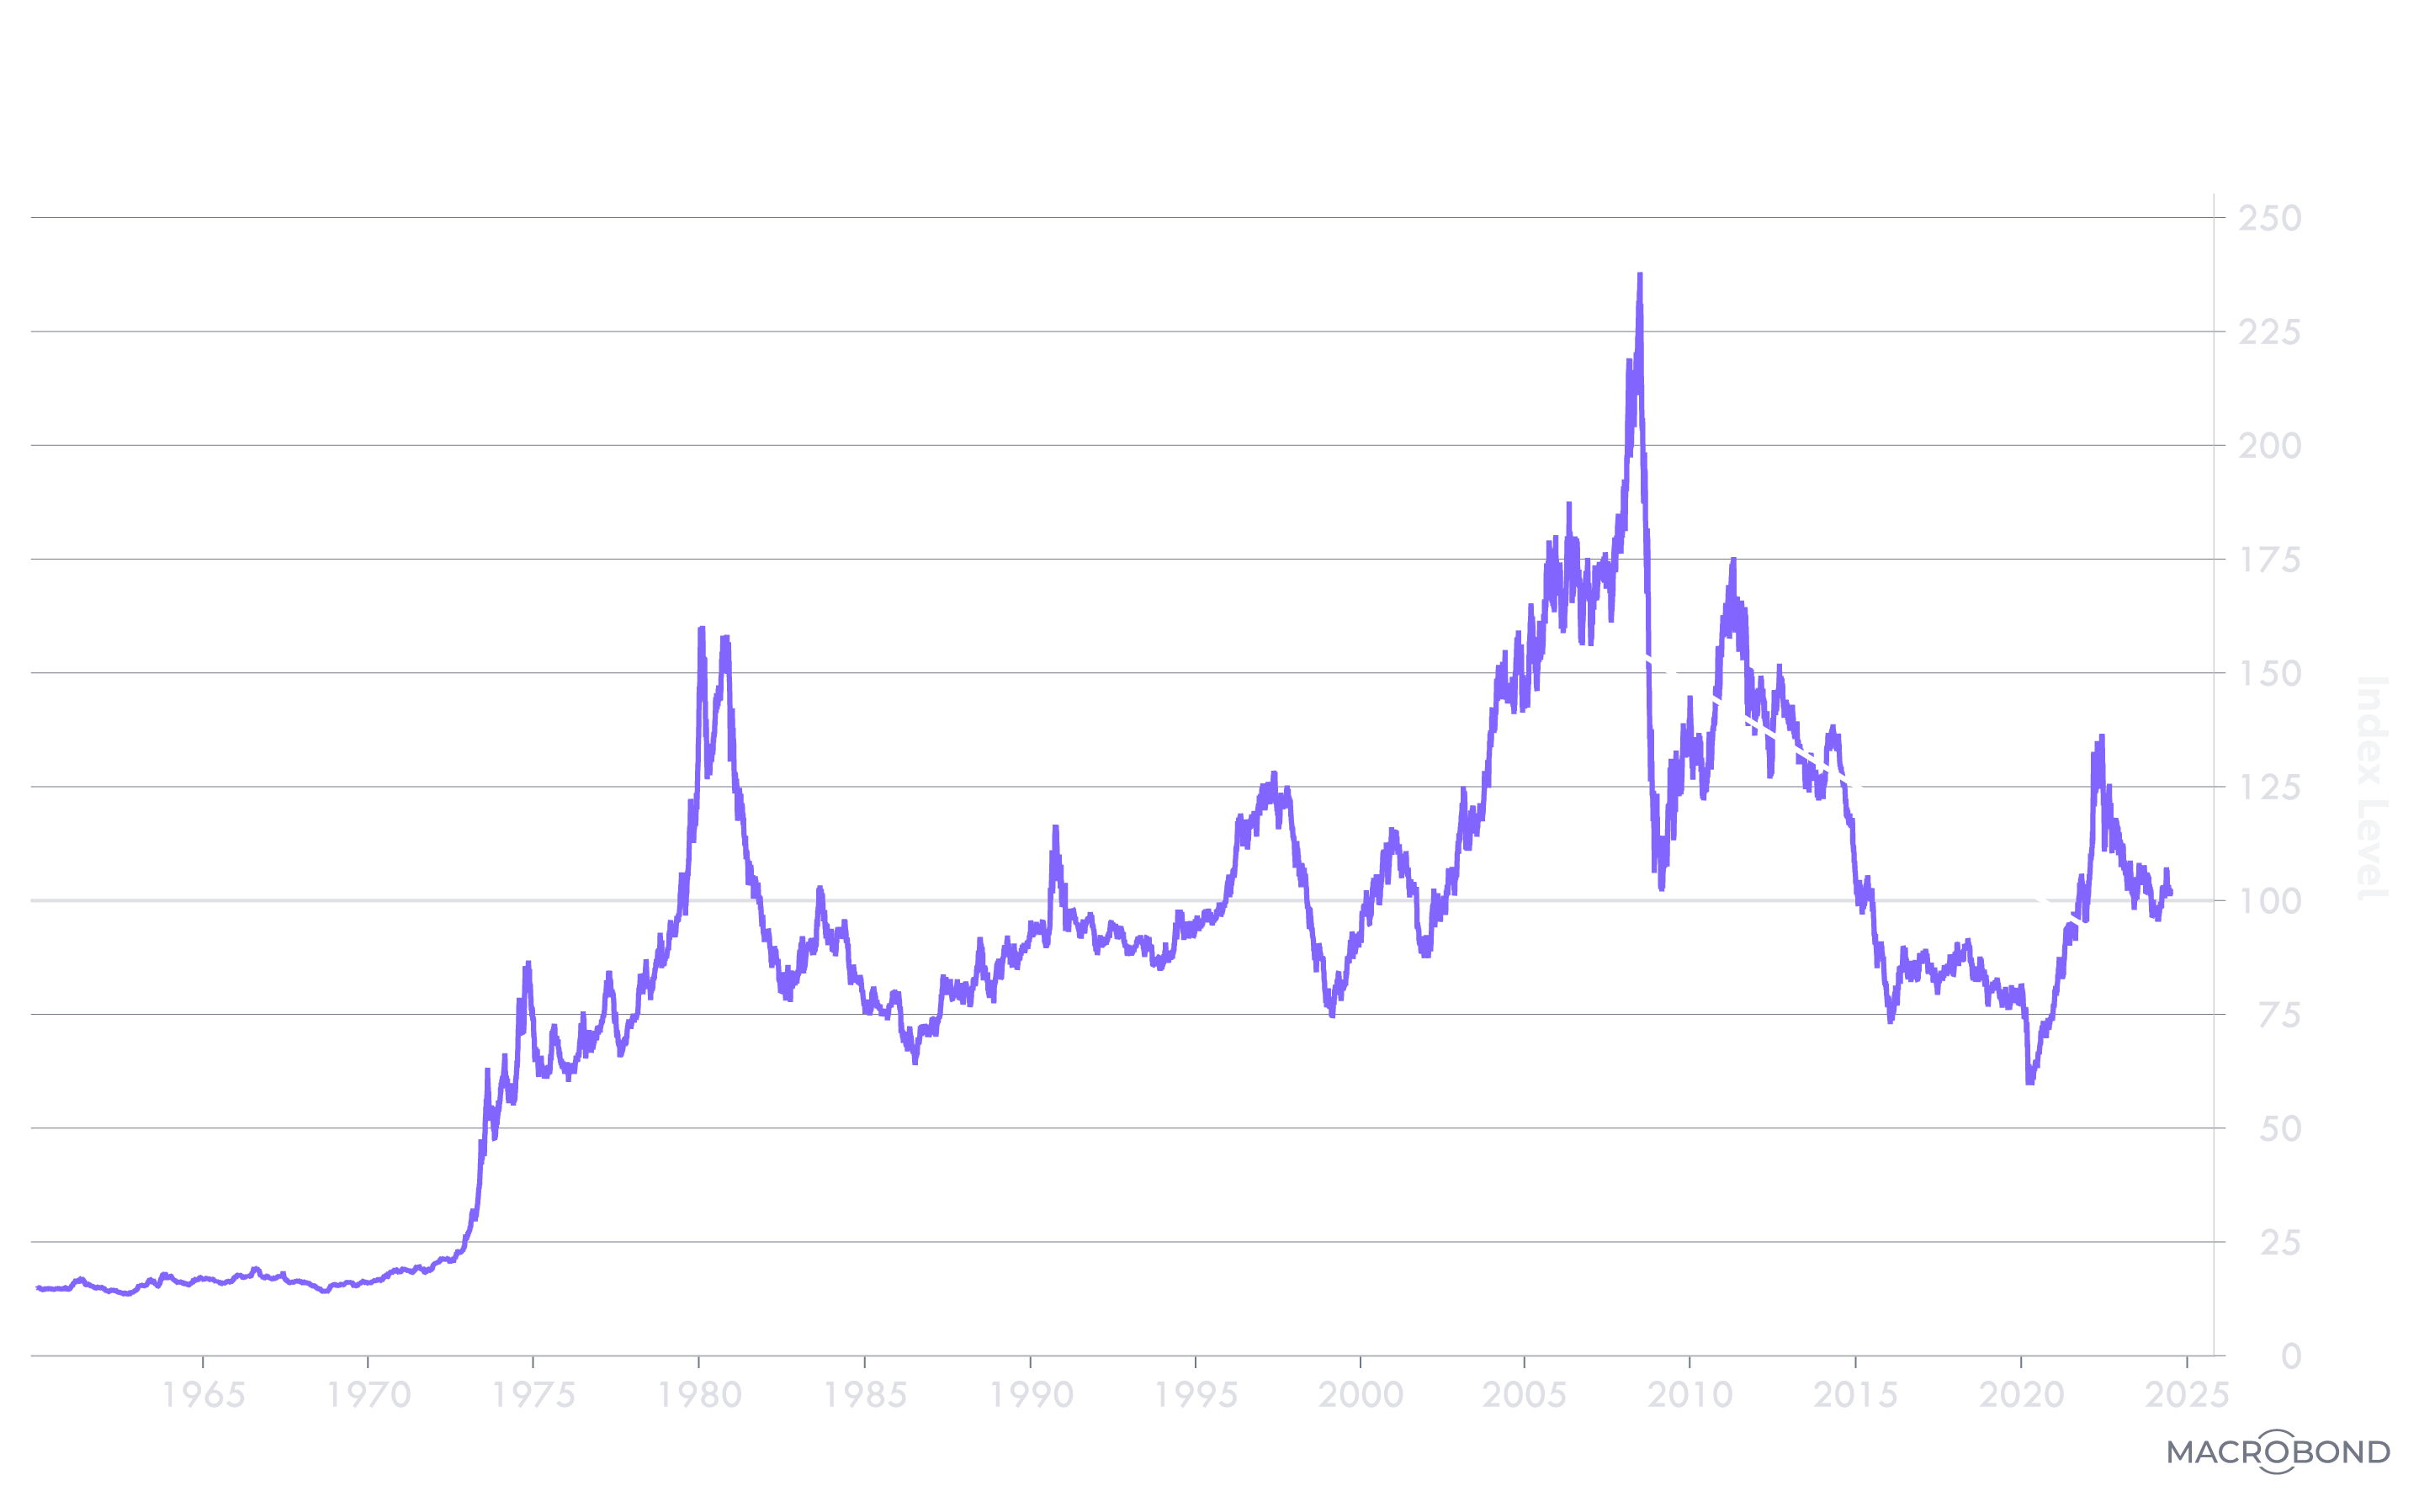
Commodity Price Signals: The Commodity Index
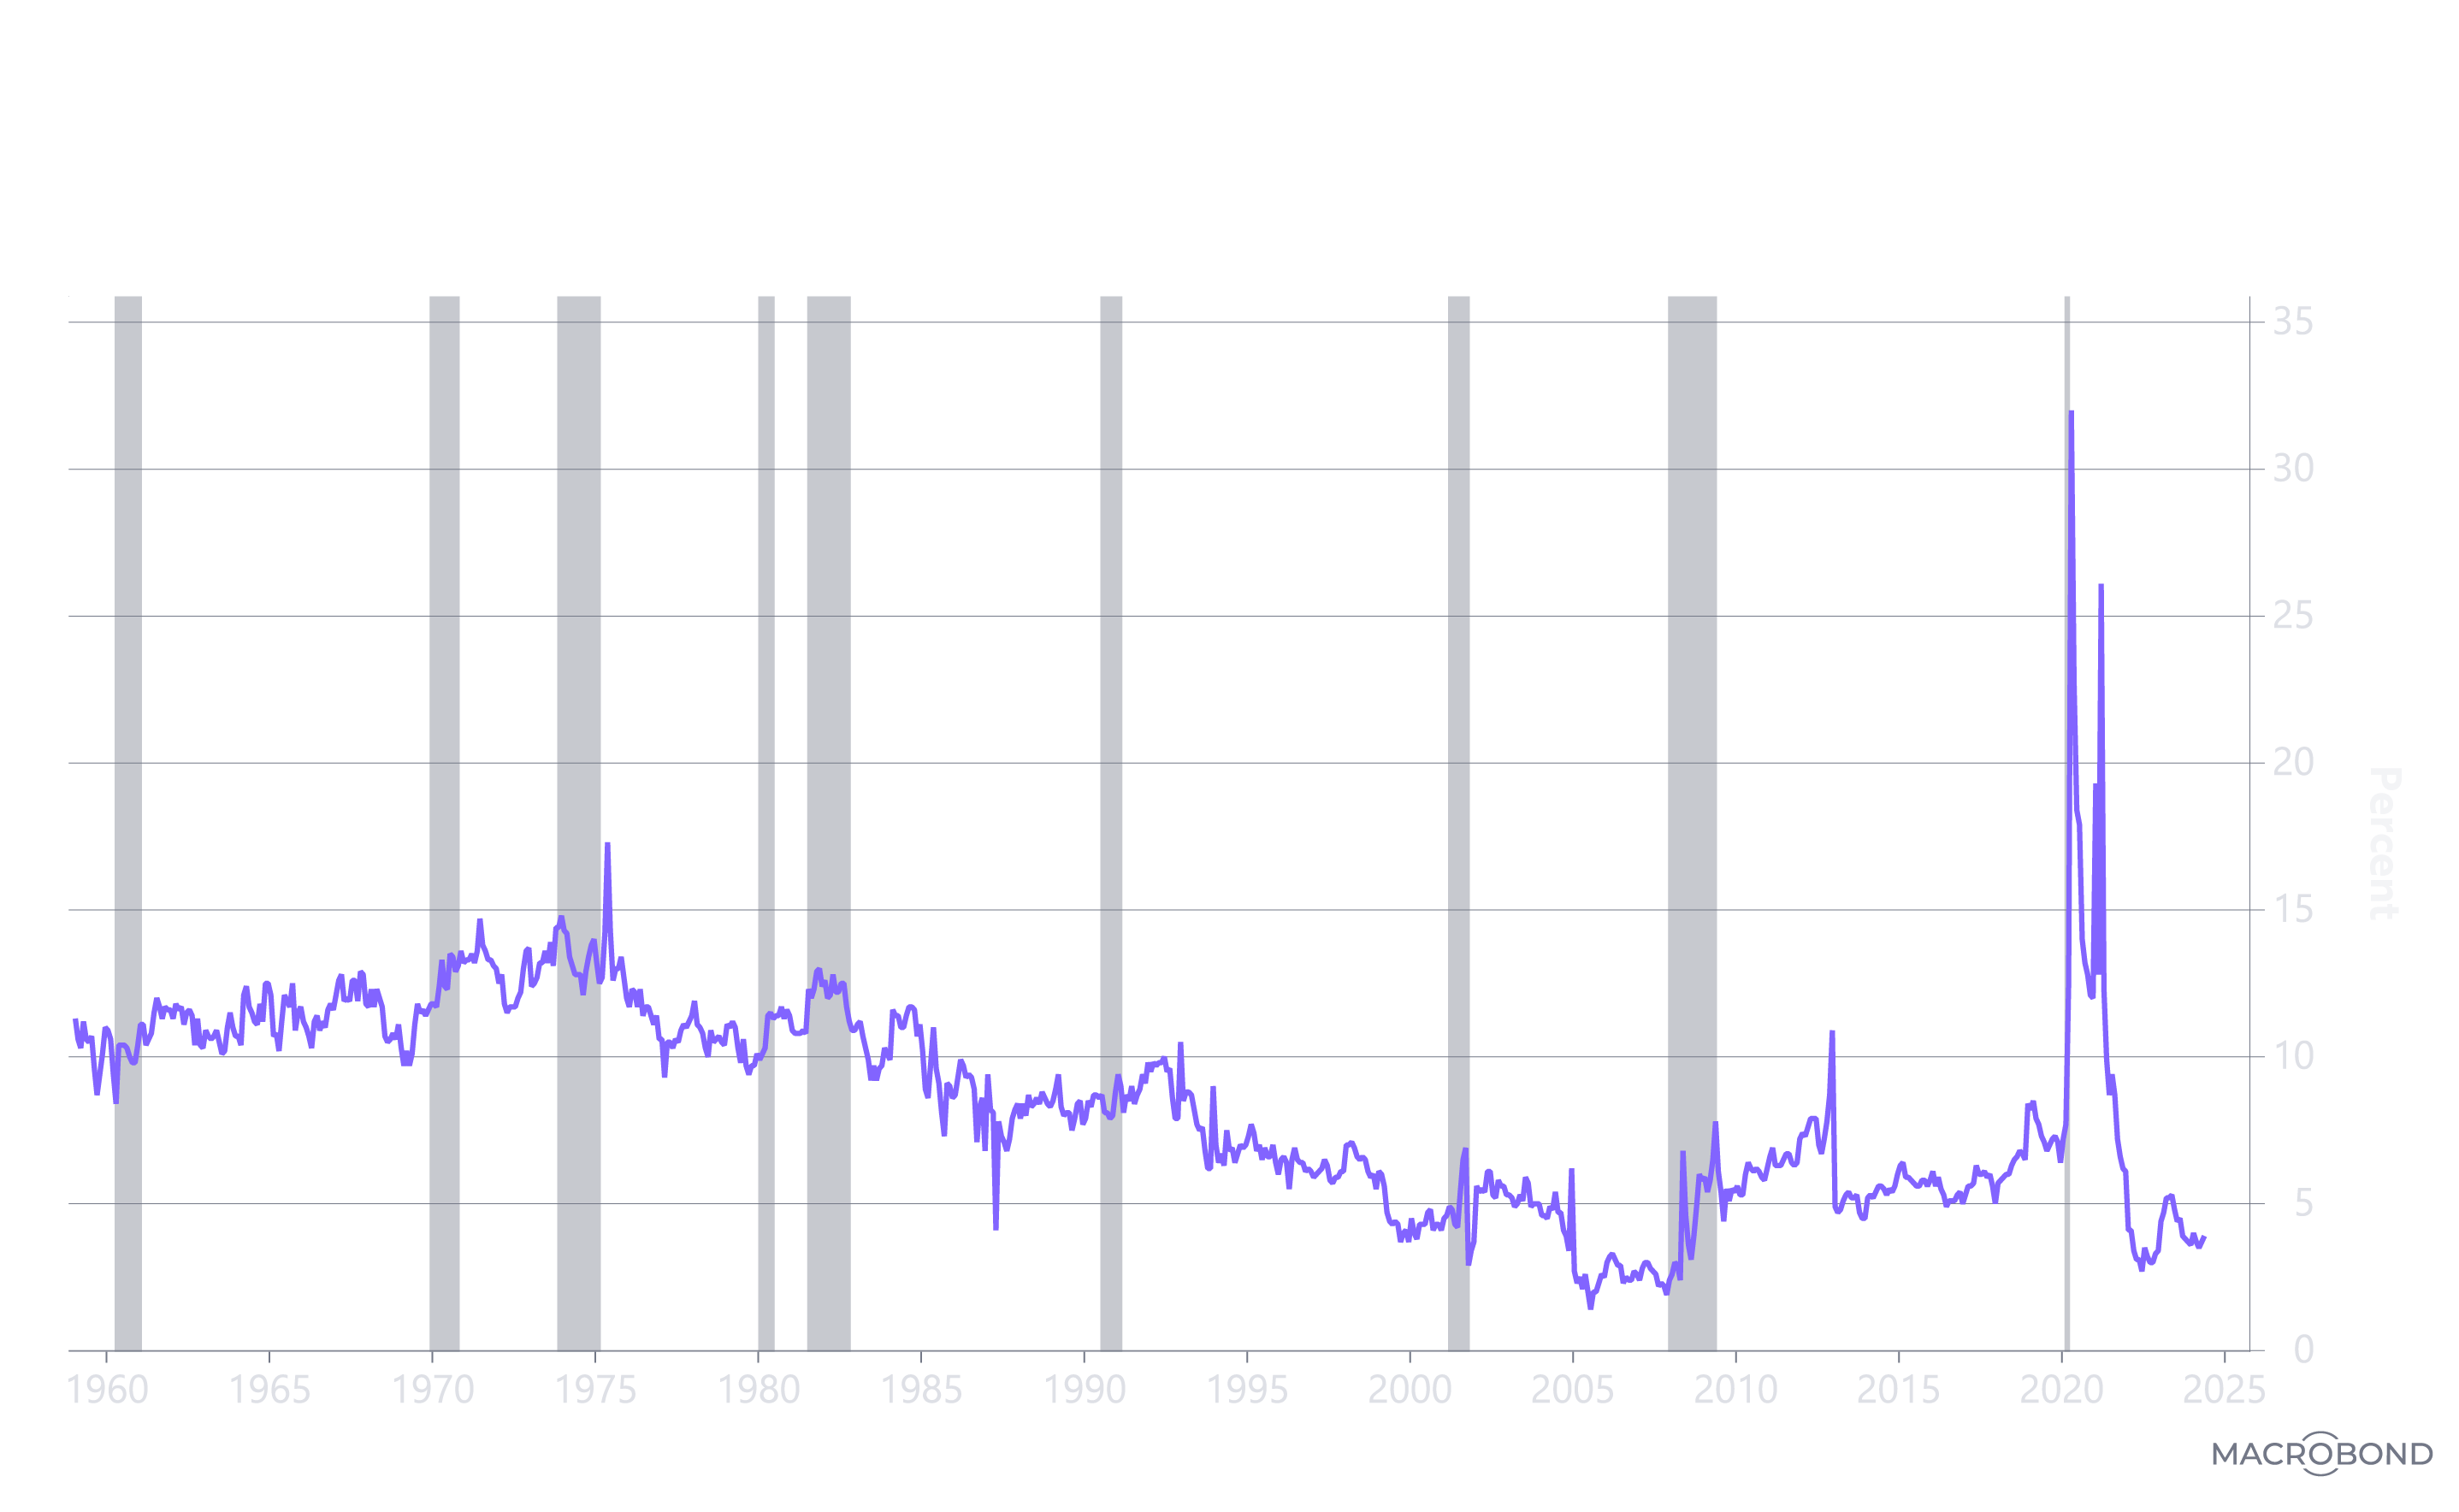
Why have commodity prices trended down since 2008, and why are they today at the same level as in 1984? Lending more perspective to the commodity price signal is a longer-term chart of the broader based Bloomberg Commodity Price Index (BCOM). After the surge in food and energy prices and the Fed's tough talk about inflation during the past two years, investors may be surprised to learn that BCOM today is where it was more than 40 years ago, as shown below.
Source: ARK Investment Management LLC, 2024, based on data from Macrobond as of May 31, 2024. For informational purposes only and should not be considered investment advice or a recommendation to buy, sell, or hold any particular security or commodity. Past performance is not indicative of future results.
Once I realized that BCOM had dropped back to levels hit during the early days of my career, I had a flashback to another debate that few in our business today may recall: the existence of a Kondratieff super cycle. Characterized by decades-long waves of inflation and deflation, the concept of a wave continuing today might be associated not only with technologically enabled innovation but also with China exporting deflation to resuscitate its economy.5
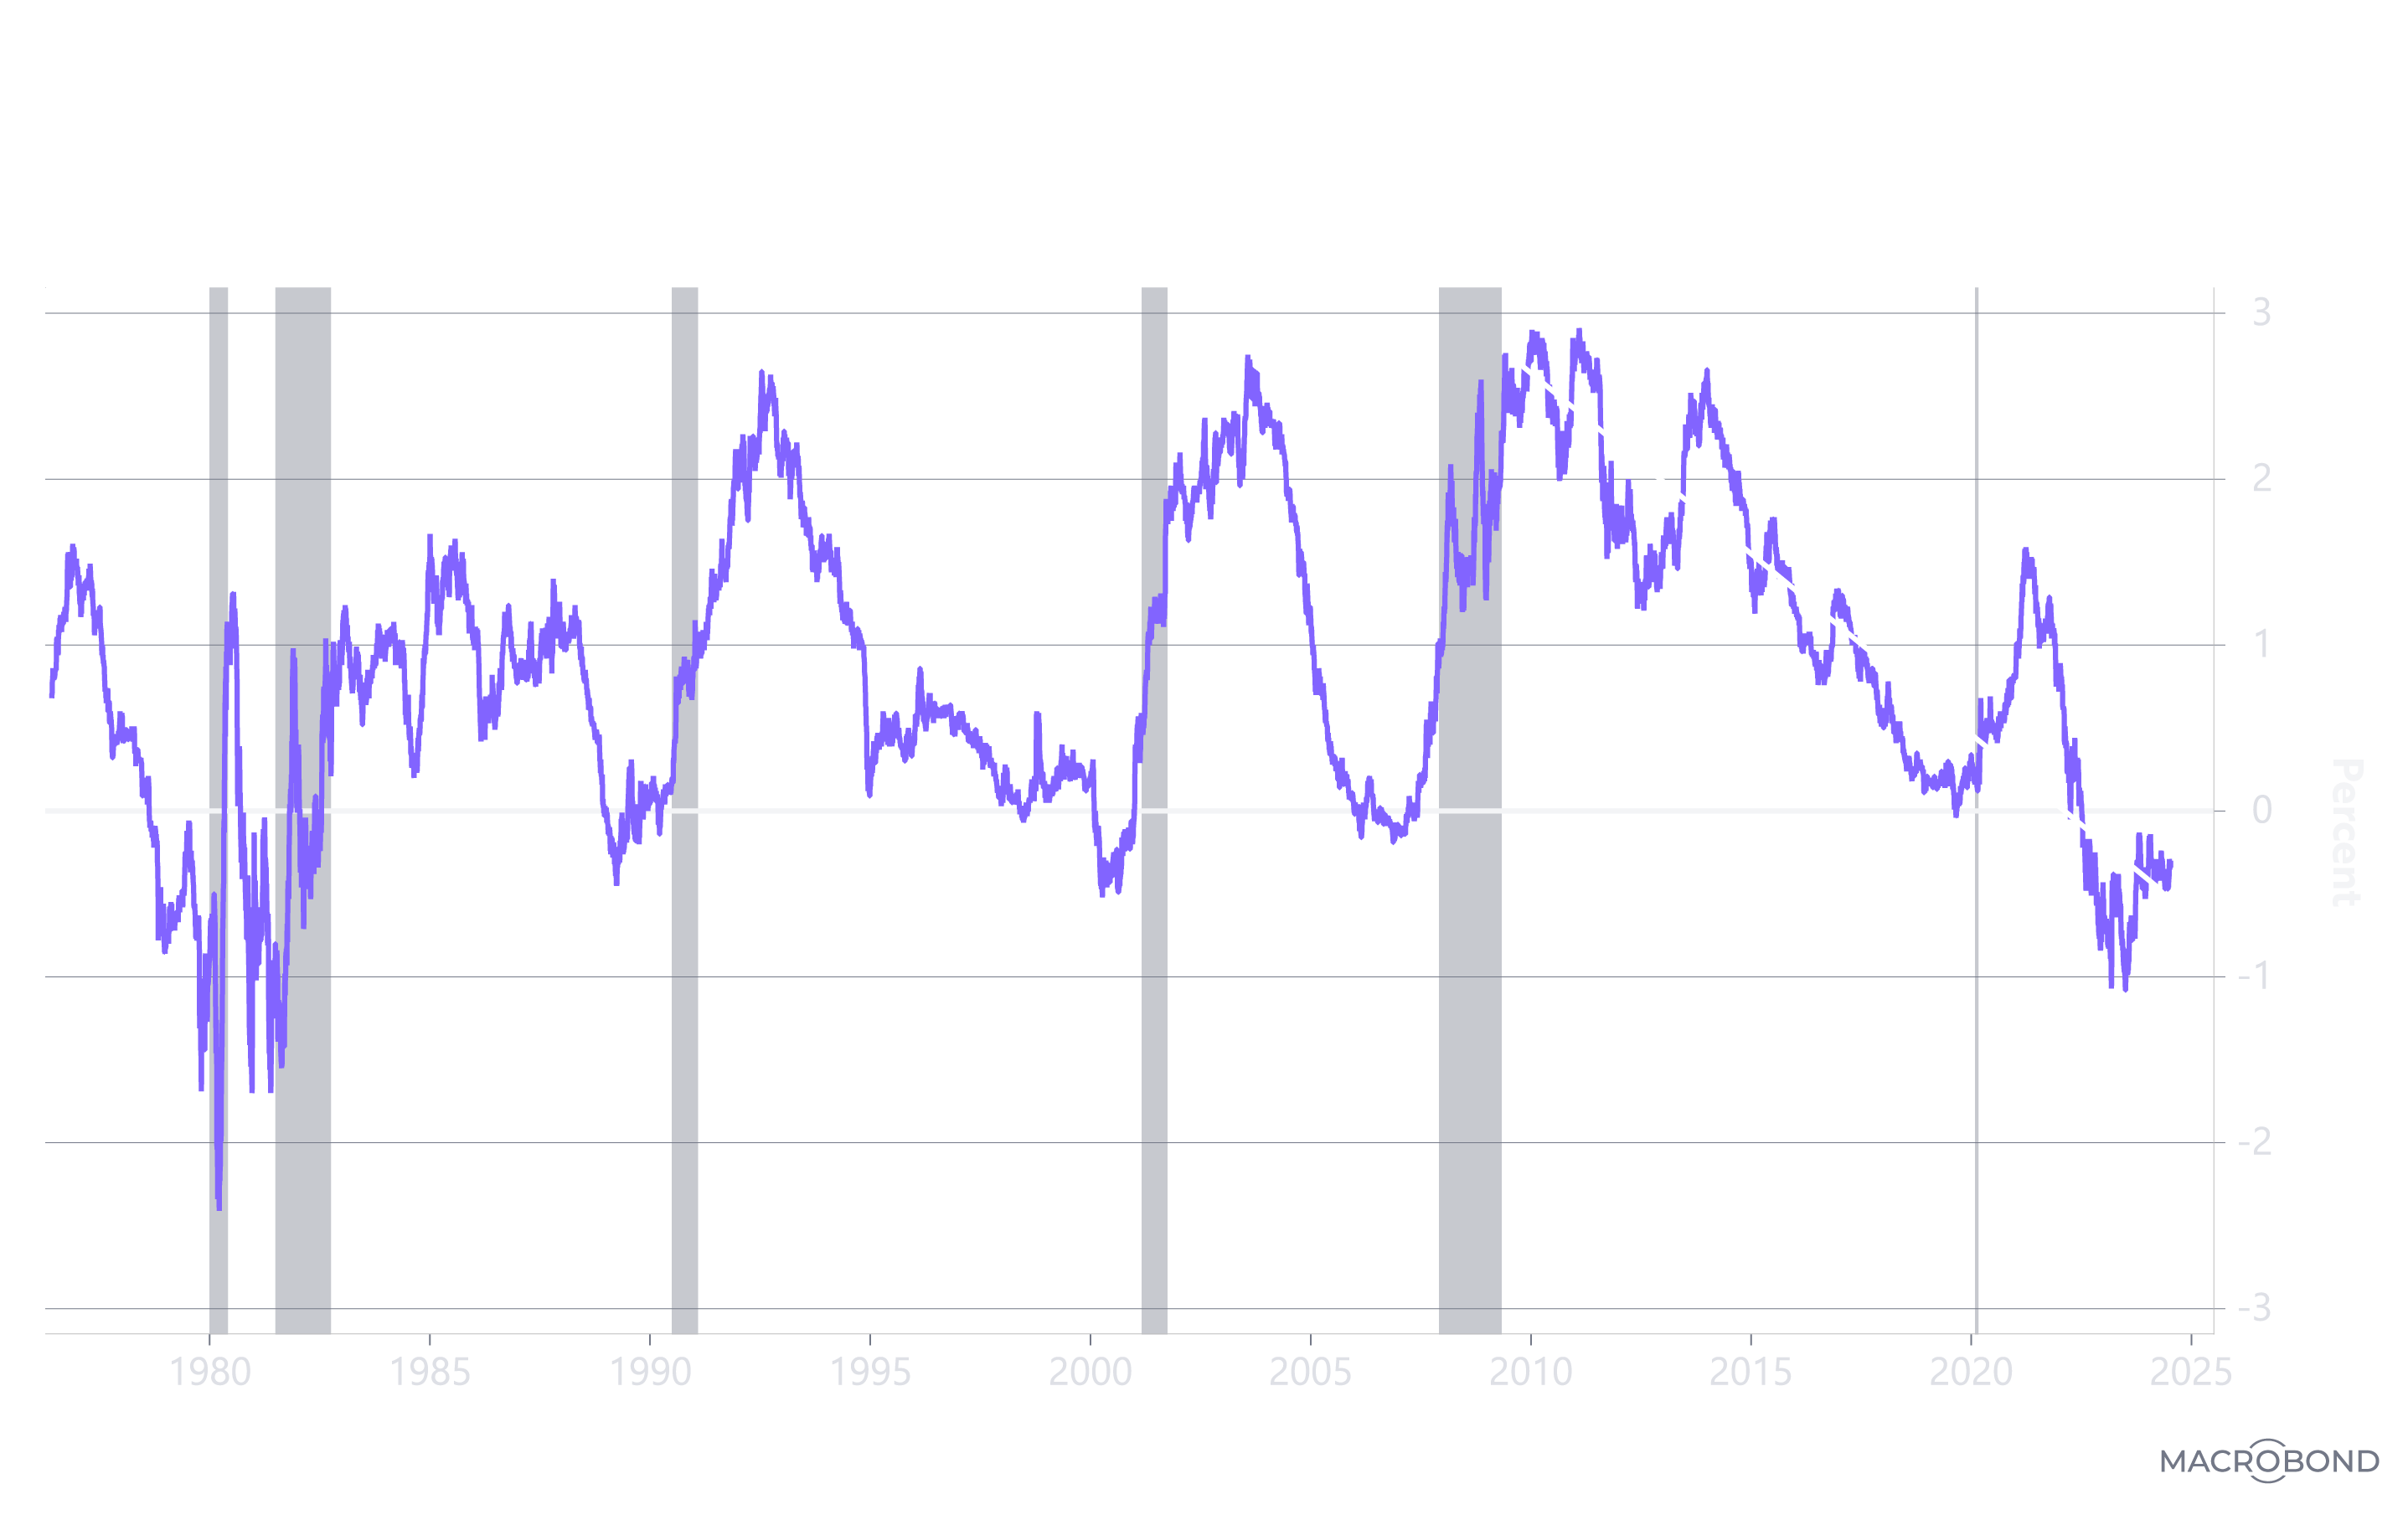
Interest Rate Signals: The Yield Curve
Why has the yield curve been flattening for more than a decade, and why has it been inverted for more than two years? The yield curve suggests that a deflationary Kondratieff wave has been brewing for years, as shown below.
Source: ARK Investment Management LLC, 2024, based on data from Macrobond as of May 31, 2024. For informational purposes only and should not be considered investment advice or a recommendation to buy, sell, or hold any particular security. Past performance is not indicative of future results.
As measured by the 10-year Treasury yield relative to the 2-year Treasury yield, the steepening in 2021 did not break the downtrend in the yield curve that began ten years earlier in 2011-12, even though fiscal and monetary stimulus soared to record levels globally during the COVID crisis. Why didn’t the yield curve steepen into the 200-300 basis point range that has characterized every other cycle since the late eighties? Have long bond yields been signaling the existence of deflationary undercurrents that were masked by flawed headline inflation gauges?
Invariably since WWII, inverted yield curves have been harbingers of recession in the US. Many sectors in the economy already have rolled into recession during the last two years: housing, autos, office/multi-family commercial real estate, and now capital spending. The unemployment rate bottomed out at 3.4% nearly a year and a half ago in January 2023 and has increased to 4%. Interestingly, since peaking in December 2021, the Index of Leading Economic Indicators has dropped by 14.7%, and still is falling. The last time this indicator dropped for such a long period of time and to such an extent was prior to the Global Financial Crisis.
Corporations are losing pricing power, which is putting pressure on profit margins,6 suggesting that the unemployment rate will rise at a more rapid clip during the next year. Meanwhile, not only has the consumer run out of pandemic stimulus savings but the consumer saving rate is down to 3.6%,7 a level not seen since 2008. In our view, the economy is continuing its slow recession roll, and not until the Fed eases significantly will the yield curve normalize.
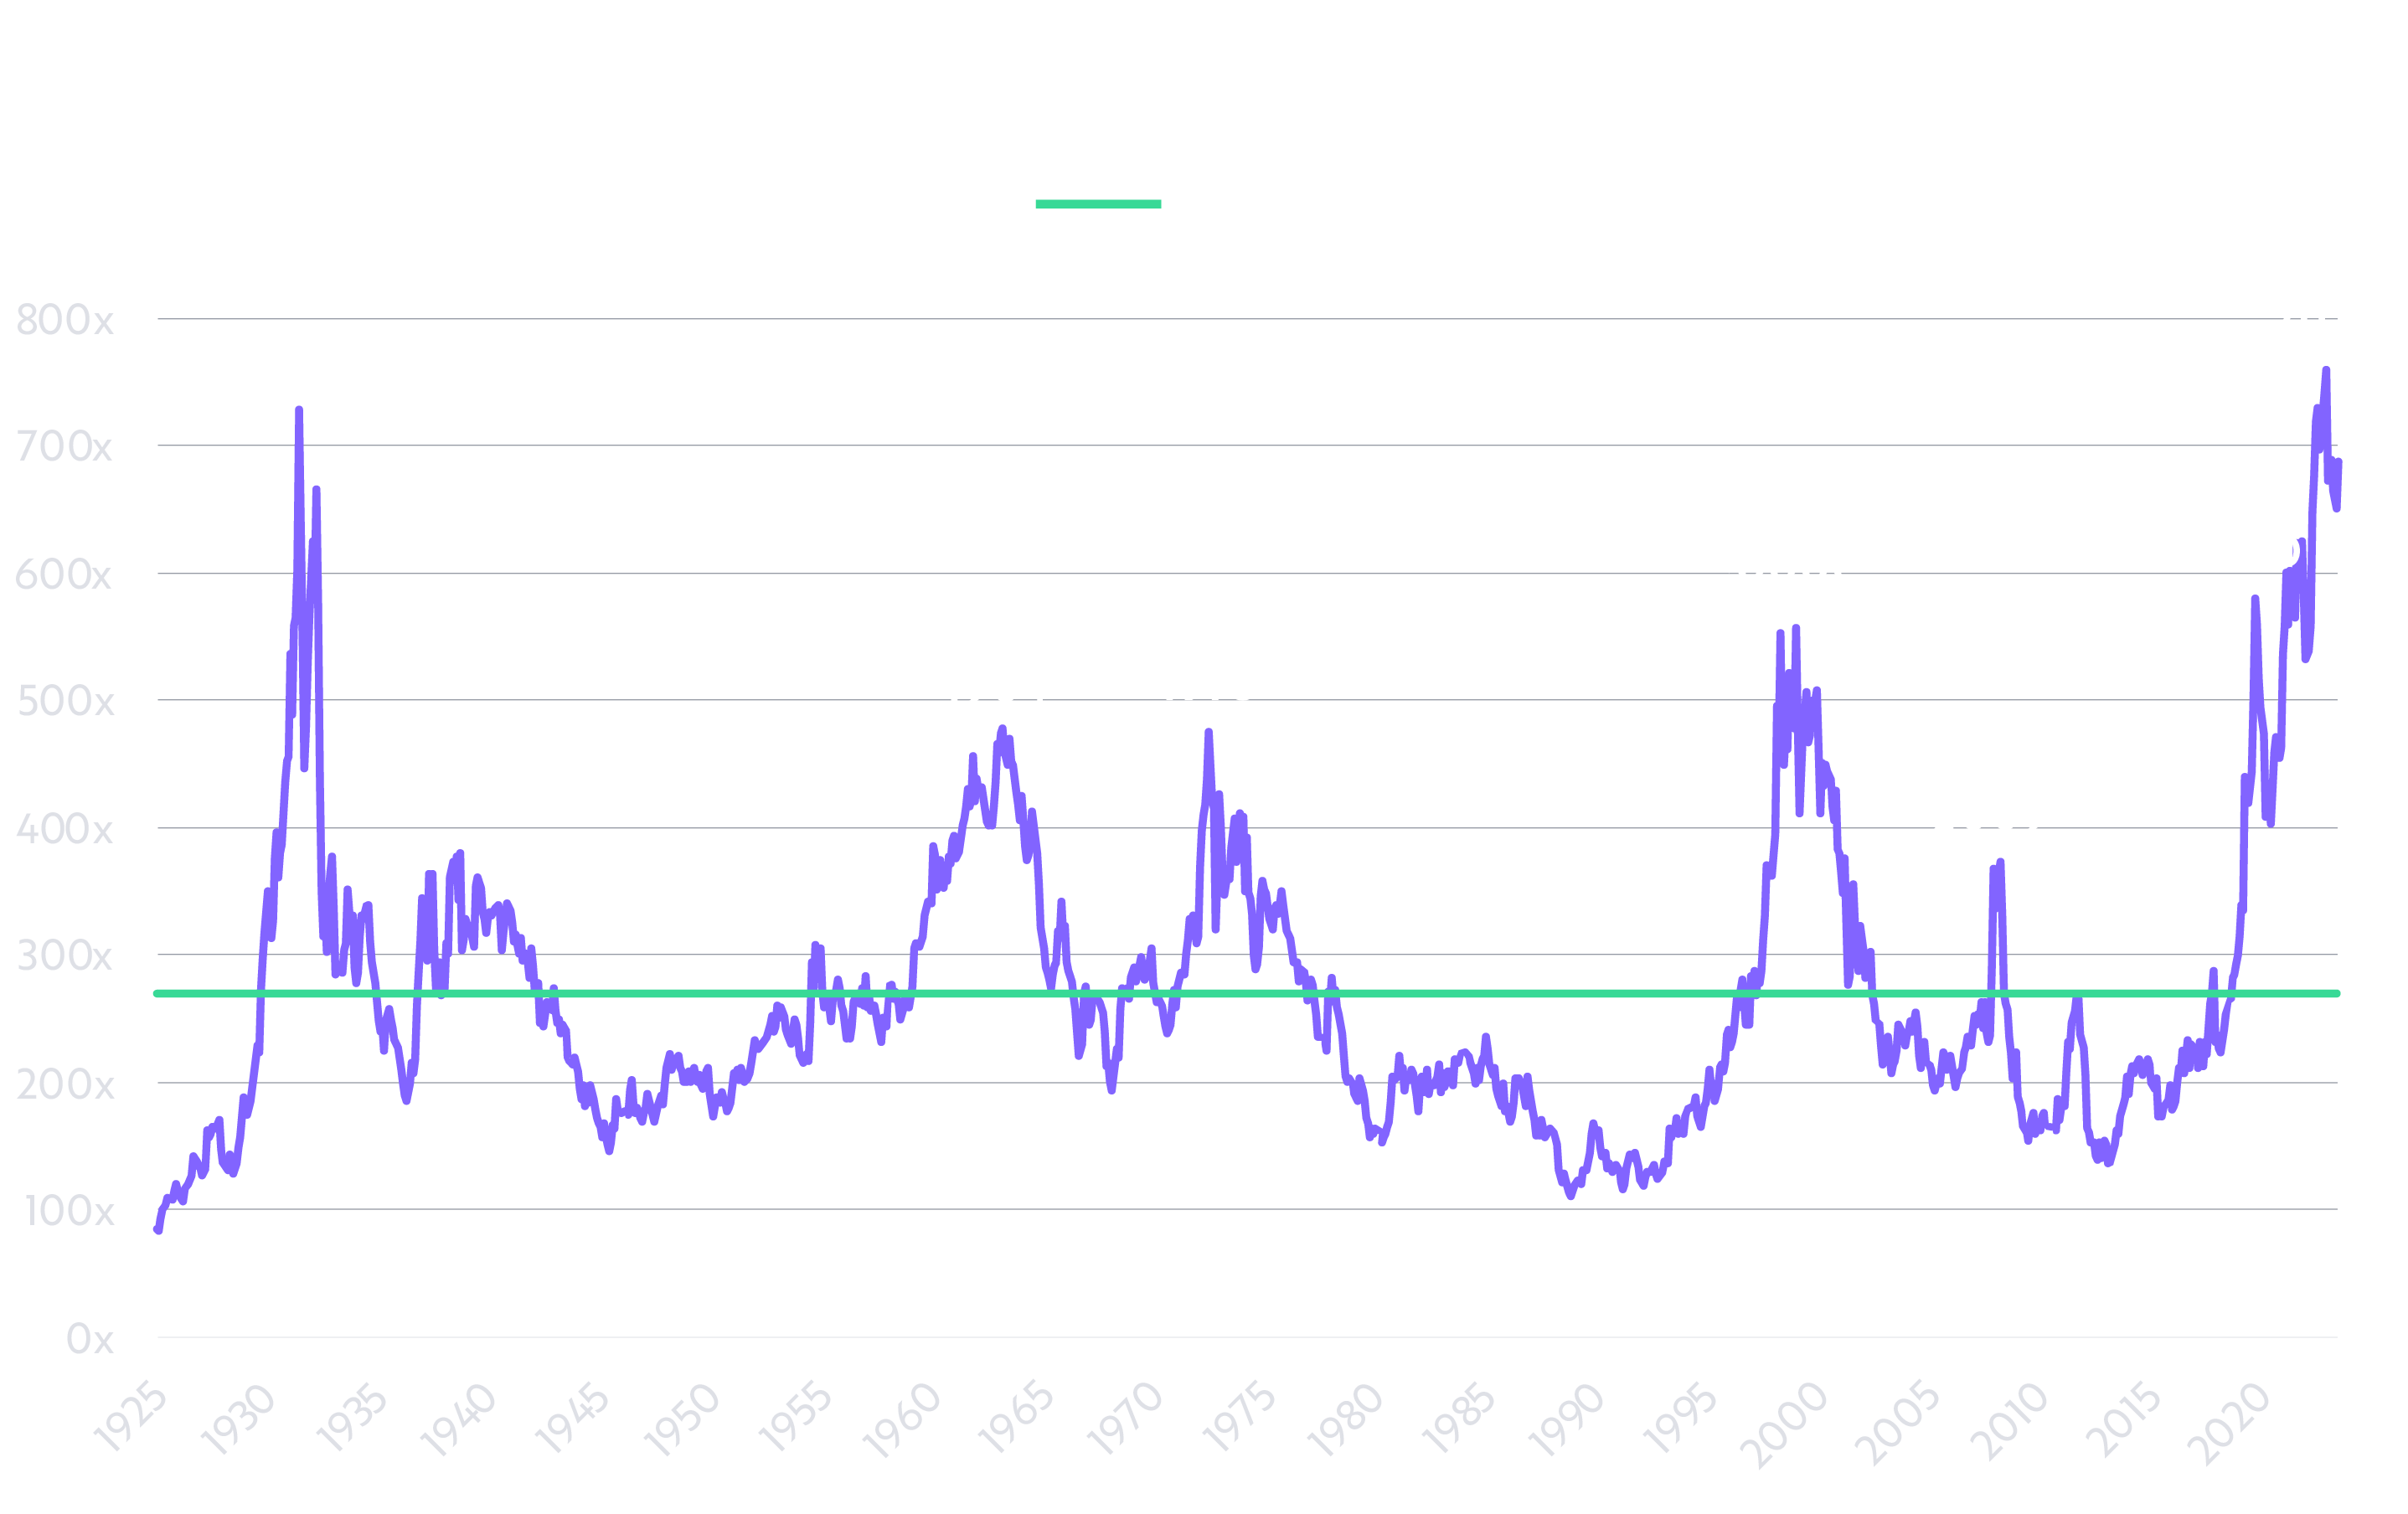
Equity Market Signals: Concentration
The rolling recession could explain why the market has rewarded only a few stocks during the last two years. Ironically, in the most stringent anti-trust environment in recent memory, the capitalization of the equity markets has never been more concentrated, as measured by the ratio of the highest market cap stock in the US equity market relative to the 75th percentile stock. In recent months, the concentration surpassed that seen in the Great Depression from 1929 to 1932, during which time the unemployment rate soared to 25%, real Gross Domestic Product (GDP) fell 29%, the wholesale price index dropped 32%, and the consumer price index dropped 25%. Clearly and understandably, in 1932 the market was evaluating companies with a binary filter—bankruptcy or no bankruptcy—based on cash cushion and free cash flow.
Source: ARK Investment Management LLC, 2024, based on data from Macrobond as of May 31, 2024. For informational purposes only and should not be considered investment advice or a recommendation to buy, sell, or hold any particular security. Past performance is not indicative of future results.
In comparison, despite the relatively benign economic environment today, equity markets have behaved similarly, rewarding companies with large cash cushions and free cash flow, in addition to surprising short-term revenue growth associated with “AI.” From our point of view, many of those “AI” opportunities fall into the category of sustained innovation,8 favoring the data aggregators that capitalized on the first leg of the internet revolution. While perhaps correct in the short term, the most important AI investment opportunities in the future are likely to be much more disruptive: in other words, the most significant technology platform shift in history should create surprising winners and losers, particularly, a more diverse set of winners to which the current equity market concentration will give way.
Two dates in the concentration chart above—1973 and 2000—stand out, because they indicate peaks in the equity market after Fed policy erred on the side of easing. Those narrow markets ended badly. The former sealed the demise of the “Nifty Fifty” like Xerox and Avon Products, while the latter signaled the end of the tech and telecom bubble. In 1973, after the US closed the gold window, monetary policy became unhinged, financing “guns and butter” fiscal policy and accommodating a quadrupling in oil prices, not to mention generalized commodity price inflation. Equity market valuations went into a tailspin for nearly a decade, pushing the price-to-earnings (P/E) ratio of the S&P 500 down from 18.4x in 1972 to 6.7x in 1980. Likewise, by 2000, monetary policymakers had eased consistently in response to the implosion of Long Term Capital Management in 1998, the risks of a global shutdown associated with Y2K at the turn of the Millenium, and the tech and telecom bust in 2000. As a result, the P/E of the Nasdaq 100 dropped from 200x in 20009 to 30x in 2004 and 13x in 2008.10
Today, the risk appears to be the opposite: restrictive monetary policy caused by the Fed’s concern that it let the inflation genie out of the bottle during the COVID crisis. In Chairman Powell’s words, Fed policy is “restrictive.” Unlike in 1973 and 2000 when M211 increased 6.6% and 6.2% on a year-over-year basis, respectively, money growth turned negative and stayed negative on a year-over-year basis from December 2022 through March 2024 and now, at 0.6%, is still extremely weak by historical standards.
Unlike in 1973 and 2000, other peaks in equity market concentration signaled the beginning of broader-based equity bull markets: 1932, 1964, and 2009. From peak concentration in 1932, for example, the S&P 500 appreciated ~269%, or ~9.8% at an annual rate, through 1945 while small caps outperformed large caps by ~13.6% at an annual rate. In the earlier stage of that bull market, from peak concentration in 1932 to the interim low in 1936, small caps outperformed large caps by 23.4% at an annual rate. Both 1964 and 2009 played out similarly, with small caps outperforming large caps by 22.2% at an annual rate in the 1964 cycle and 4.8% from 2009-2013.
Conclusion
In our view, having already paid dues with tight money and higher interest rates in this cycle, the next few years could prove fertile for the broad swath of the equity market beyond the Magnificent Six. As inflation and interest rates continue to unwind during the next few years, smaller-cap stocks should have much more compelling upside potential relative to the mega caps now dominated by the Magnificent Six.
Appendix
NIPA Profit Margin
Source: ARK Investment Management LLC, 2024, based on data from Macrobond as of May 31, 2024. For informational purposes only and should not be considered investment advice or a recommendation to buy, sell, or hold any particular security or cryptocurrency. Past performance is not indicative of future results.
Personal Saving Rate
Source: ARK Investment Management LLC, 2024, based on data from Macrobond as of May 31, 2024. For informational purposes only and should not be considered investment advice or a recommendation to buy, sell, or hold any particular security or cryptocurrency. Past performance is not indicative of future results.
Important Information
Investors should carefully consider the investment objectives and risks as well as charges and expenses of an ARK Fund before investing. This and other information are contained in the ARK ETFs’ and ARK Venture Fund’s prospectuses and summary prospectuses, which may be obtained by visiting www.ark-funds.com. The prospectus and summary prospectus should be read carefully before investing.
An investment in an ARK Fund is subject to risks and you can lose money on your investment in an ARK Fund. There can be no assurance that the ARK Funds will achieve their investment objectives. The ARK Funds’ portfolios are more volatile than broad market averages. The ARK Funds also have specific risks, which are described in their prospectuses.
Certain statements made in this material are strictly beliefs and points of view held by ARK Investment Management LLC and are subject to change without notice. Certain information was obtained from sources that ARK believes to be reliable; however, ARK does not guarantee the accuracy or completeness of any information obtained from any third party. The information provided is for informational purposes only and should not be considered as investment advice or a recommendation of any particular security, strategy or investment product. The information provided is general in nature and should not be considered legal or tax advice.
Index Descriptions: The S&P 500 is a stock market index tracking the stock performance of 500 of the largest companies listed on stock exchanges in the United States. The Nasdaq 100 Index is a stock market index made up of 101 equity securities issued by 100 of the largest non-financial companies listed on the Nasdaq stock exchange.
“Fed” refers to the U.S. Federal Reserve, the central banking system of the United States.
Fed Funds Rate is the interest rate at which depository institutions (banks and credit unions) lend reserve balances to other depository institutions overnight on an uncollateralized basis.
Yield Curve is a graphical representation of the interest rates on debt for a range of maturities. It shows the yield an investor is expecting to earn if they lend their money for a given period of time. An inverted curve appears when long-term yields fall below short-term yields. An inverted yield curve occurs due to the perception of long-term investors that interest rates will decline in the future.
Gross Domestic Product (GDP) is the total monetary or market value of all the finished goods and services produced within a country’s borders in a specific time period. Nominal GDP is a measure of economic output that uses current prices and does not adjust for inflation. Real GDP is an economic metric that is used to describe the economic output of a country within a specific year. It reflects the value of all goods and services produced while factoring inflation into its calculation.
The “Nifty Fifty”, as referenced in this material, was a group of 50 large-cap stocks on the New York Stock Exchange that were most favored by institutional investors in the 1960s and 1970s. Investment in these top 50 stocks—similar to blue-chip stocks of today—is said to have propelled the American economy to its bull market of the 1970s.
"Guns and Butter", as referenced in this material, describes the government allocation to defense spending versus social programs.
The price-to-earnings (P/E) ratio measures a company's share price relative to its earnings per share (EPS). The P/E ratio helps assess the relative value of a company's stock. A high P/E ratio could mean that a company's stock is overvalued or that investors expect high growth rates.
“Y2K”, or the year 2000, refers to potential computer errors related to the formatting and storage of calendar data for dates in and after the year 2000. Many programs represented four-digit years with only the final two digits, making the year 2000 indistinguishable from 1900. Contrary to published expectations, few major errors occurred in 2000.
Market capitalization, or "market cap," represents the total dollar market value of a company's outstanding shares of stock. Small-cap companies are those with a market cap between $250 million and $2 billion. Large-cap companies are those with a market cap of more than $10 billion. Mega-cap companies are those with a market cap of more than $200 billion.
“Magnificent 6”, as referenced in this material, is a term adopted by the financial industry to describe the top six technology companies currently investing heavily in artificial intelligence (AI). The six companies are Meta Platforms, Alphabet, Apple, Amazon, Microsoft and Nvidia.
ARK Investment Management LLC is the investment adviser to the ARK Funds.
Foreside Fund Services, LLC, distributor.
The Magnificent Six or “Mag 6” stocks are a group of high-performing and influential companies in the US stock market: Alphabet, Amazon, Apple, Meta Platforms, Microsoft and NVIDIA.
The “metals” category comprises Copper Scrap, Steel Scrap, Zinc, Lead Scrap, and Tin. See CMDTY by Barchart. 2017. “CRB BLS Spot Indexes.”
Correlation, in the finance and investment industries, is a statistic that measures the degree to which two securities move in relation to each other. Positively correlated assets move similarly, and negatively correlated assets move in opposite directions.
A basis point (bp) is a unit of measurement that represents 1/100th of 1%, or 0.01%, of a percentage.
By “exporting deflation” we refer to a process in which China sells its products to the US market at deflated prices, or for lower prices than otherwise would be possible, which it is able to do in part because the Chinese government subsidizes its economy.
See the NIPA profit margin chart in the Appendix.
See the Personal saving rate chart in the Appendix.
For a deeper discussion of “sustained” versus “disruptive” innovation, please see (Cathie Letter Part I, published previous week). Wood, C. 2024. “What We Do: A Letter To Investors From Cathie Wood.” ARK Invest. https://www.ark-funds.com/articles/etf/a-letter-to-investors-from-cathie-wood
Shafer, B. 2023. “Are Stocks In A Bubble?” The Motley Fool.
Based on data from Bloomberg.
M2 is a measure of the US money stock that includes M1 (currency and coins held by the non-bank public, checkable deposits, and travelers’ checks) plus savings deposits (including money market deposit accounts), small time deposits under $100,000, and shares in retail money market mutual funds.
ARK’s statements are not an endorsement of any company or a recommendation to buy, sell or hold any security. ARK and its clients as well as its related persons may (but do not necessarily) have financial interests in securities or issuers that are discussed. Certain of the statements contained may be statements of future expectations and other forward-looking statements that are based on ARK’s current views and assumptions and involve known and unknown risks and uncertainties that could cause actual results, performance, or events to differ materially from those expressed or implied in such statements.

ARK Trade Notifications
ARK offers fully transparent Exchange Traded Funds (“ETFs”) and provides investors with trade information for all actively managed ETFs.
