

As we enter the second half of 2025, investors face the critical question: Is my portfolio positioned for the future, or anchored to the past? Traditionally, equity allocations dominated by US, international, and emerging market exposures have served investors well. Today, however, as AI reshapes industries and economies, allocating a portion of one’s portfolio to innovation-driven ETFs focused on artificial intelligence (AI) could enhance long-term performance potential.
According to ARK’s research, portfolios that integrated AI through ETFs like the ARK Next Generation Internet ETF (ARKW) and the ARK Autonomous Tech. & Robotics ETF (ARKQ) in the period January 2015 to June 2025 would have delivered superior risk-adjusted returns and moved closer to what is known in finance as the “efficient frontier.”1
While this paper focuses on how to gain exposure to artificial intelligence in an overall equity portfolio, ARK’s most powerful AI-focused ETFs—ARKW and ARKQ—also provide exposure to cryptocurrency and robotics, respectively. As a result, our analysis also considers how investors may tailor their AI allocations based on their relative preferences for crypto or robotics exposure. In other words, this is not an analysis of pure-play AI allocation. Instead, it is a framework for thinking about how investors can use differentiated innovation themes to express conviction in AI, depending on the kindred technologies that they believe will drive performance the most.
What Is The Efficient Frontier And Why Should You Care?
The efficient frontier is the best possible return an investor can achieve for any given level of risk. Portfolios that sit on the efficient frontier use diversification and smart asset allocation to maximize performance relative to volatility, as measured by standard deviation.2 In simple terms, the efficient frontier is where you want your portfolio to be, wringing the most reward from every unit of risk you take.
ARK’s research suggests that adding exposure to AI in a global equity portfolio has the potential to push a portfolio closer to that ideal, unlocking better returns while avoiding disproportionate risk.
.png)
Adding Artificial Intelligence To Portfolios: An Illustrative Case Study
To support investors in their efforts to incorporate AI within a well-diversified portfolio, we analyzed four model portfolios with an inception date of September 30, 2014.
- A Reference Portfolio: 60% US equity, 30% international developed equity, 10% emerging market equity, and no AI exposure. The Reference Portfolio allocations were designed as a simplified global equity benchmark, giving readers a clear basis upon which to evaluate portfolios that do incorporate AI. The index ETFs were selected because they closely track the target regional allocations.
- Three portfolios with increasing allocations to AI, using the ARK Next Generation Internet ETF (ARKW) for AI & cryptocurrency, or the Autonomous Tech. & Robotics ETF (ARKQ) for AI & robotics.
- An Optimal Portfolio: Identified through efficient frontier calculations as delivering the highest return for each level of risk.
We believe this comparative structure will help investors understand how incremental allocations to AI could enhance performance while preserving diversification. A chart illustrating the relative allocations of these model portfolios is shown below.
.png)
Parts of A Global Equity Model Portfolio
| As of June 30, 2024 | 3 Months | YTD | 1 Year* | 3 Years* | 5 Years* | 10 Years* | Since Inception* |
| Representation: US Market | |||||||
| Net Returns Since Inception (Jan. 23, 2004) | |||||||
| ITOT NAV | 11.06% | 5.66% | 15.18% | 19.04% | 15.85% | 12.97% | 10.09% |
| ITOT Market Price | 11.00% | 5.61% | 15.19% | 18.98% | 15.88% | 12.97% | 10.11% |
| Representation: International Developed Market (Ex US) | |||||||
| Net Returns Since Inception (Aug. 17, 2001) | |||||||
| EFA NAV | 11.54% | 20.40% | 18.17% | 15.89% | 11.28% | 6.53% | 5.96% |
| EFA Market Price | 11.26% | 20.27% | 17.67% | 15.82% | 11.23% | 6.53% | 5.99% |
| Representation: Emerging Markets | |||||||
| Net Returns Since Inception (Apr. 11, 2003) | |||||||
| EEM NAV | 11.28% | 15.59% | 15.71% | 8.99% | 6.11% | 4.18% | 8.80% |
| EEM Market Price | 11.44% | 16.45% | 16.29% | 9.04% | 6.20% | 4.29% | 8.89% |
| Representation: Artificial Intelligence (AI) | |||||||
| Net Returns Since Inception (Sep. 30, 2014) | |||||||
| ARKW NAV | 55.79% | 36.51% | 89.03% | 44.36% | 12.61% | 22.93% | 22.79% |
| ARKW Market Price | 55.93% | 36.71% | 89.18% | 44.39% | 12.62% | 22.90% | 22.77% |
| ARKQ NAV | 34.63% | 15.38% | 61.68% | 21.13% | 13.90% | 17.06% | 15.75% |
| ARKQ Market Price | 34.58% | 15.43% | 61.86% | 21.18% | 13.89% | 17.06% | 15.76% |
ARK selected a single fund manager as the consistent brand to represent the broad US market, international developed markets, and emerging markets respectively so as not to imply ARK conducted due diligence among several or many fund managers. ARK selected Blackrock, and their brand iShares specifically because iShares is one of the largest, most respected, and most trusted passive ETF providers globally that historically offers low tracking error to target exposure, has low fees relative to the industry, and has high liquidity given their scale. This research and report is a hypothetical experiment conducted to understand if an artificial intelligence strategy, as represented by the ARK Next Generation Internet ETF (ARKW) or ARK Autonomous Tech. & Robotics ETF (ARKQ), is value accretive in a total equity portfolio.
For informational purposes only and should not be considered investment advice, or a recommendation to buy, sell or hold any particular security. Past performance does not guarantee future results. The performance data quoted represents past performance and current returns may be lower or higher. The investment return and principal will fluctuate so that an investor's shares when redeemed may be worth more or less than the original cost. For the Fund’s most recent month end performance, please visit www.ark-funds.com or call 212.426.7040. Returns for less than one year are not annualized. As stated in the ARK ETFs' current prospectuses, the expense ratio for ARKW is 0.82% and for ARKQ is 0.75%.
Extraordinary performance is attributable in part due to unusually favorable market conditions and may not be repeated or consistently achieved in the future.
For the most recent month end performance for ITOT, EEM, and EFA visit www.ishares.com or call 1-800-474-2737
Additional information about fees and expense levels can be found in the ARK ETFs' prospectuses. Net asset value (“NAV”) returns are based on the dollar value of a single share of an ARK ETF, calculated using the value of the underlying assets of the ARK ETF minus its liabilities, divided by the number of shares outstanding. The NAV is typically calculated at 4:00 pm Eastern time. Market returns are based on the trade price at which shares are bought and sold on the exchange using the last share trade. Market performance does not represent the returns you would receive if you traded shares at other times. Total Return reflects reinvestment of distributions on ex-date for NAV returns and payment date for Market Price returns. The market price of ARK ETF shares may differ significantly from their NAV during periods of market volatility. ARK's actively managed ETFs are benchmark agnostic. Index performance provided as a general market indicator.
Source: ARK Investment Management LLC. Data Source: Bloomberg. Note following market representations: US Market: iShares Core S&P Total US Stock Market ETF (ITOT; Fee: 0.03%); International Developed Market (Ex US) : iShares MSCI EAFE ETF (EFA; Fee: 0.32%); Emerging Markets: iShares MSCI Emerging Markets ETF (EEM; Fee: 0.70%); Artificial Intelligence (AI): ARK Next Generation Internet ETF (ARKW; Expense Ratio: 0.82%, Inception September 30, 2014) or ARK Autonomous Tech. & Robotics ETF (ARKQ; Expense Ratio: 0.75%, Inception: September 30, 2014)
Consistent Outperformance
ARK’s analysis demonstrates that both the ARK Next Generation Internet ETF (ARKW) and the ARK Autonomous Tech. & Robotics ETF (ARKQ) have outperformed traditional equity allocations, across multiple time horizons, with remarkable consistency. Specifically, since their inception, September 30, 2014, through June 30, 2025:
- ARKW returned 22.77% annually
- ARKQ returned 15.66% annually
- By comparison:
- US equities returned 12.7% annually
- Developed international markets returned 6.2% annually
- Emerging market returned 3.7% annually
Importantly, the outperformance of ARKW and ARKQ spanned multiple market cycles, highlighting the resilience and growth potential of AI strategies in a diversified portfolio. The chart below illustrates how their focus on innovation—on AI, cryptocurrency, robotics, and related technologies—consistently generated ARKW’s and ARKQ’s superior returns relative to broad-market benchmarks.
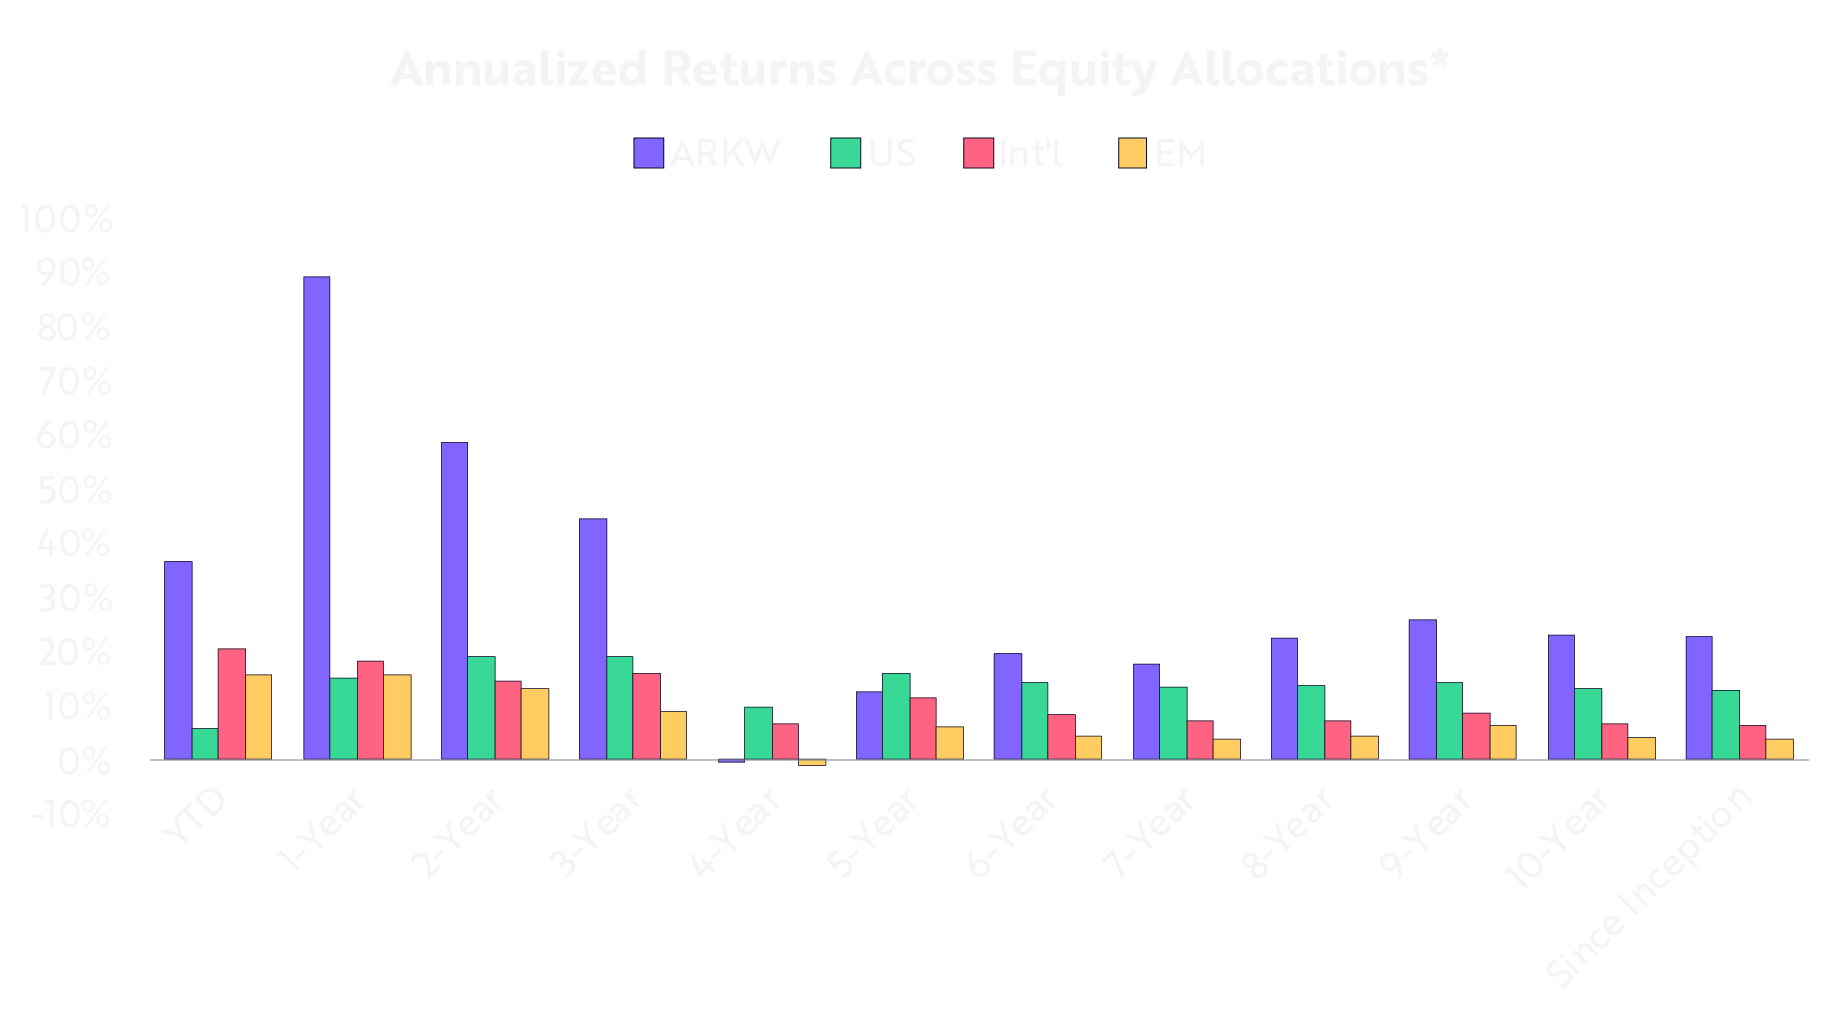
*Equity allocations are represented by the following: Domestic Equity: iShares Core S&P Total US Stock Market ETF (ITOT; Expense Ratio: 0.03%); International Equity (Ex US & Canada): iShares MSCI EAFE ETF (EFA; Expense Ratio: 0.32%); Emerging Markets: iShares MSCI Emerging Markets ETF (EEM; Expense Ratio: 0.70%); Artificial Intelligence (AI): ARK Next Generation Internet ETF (ARKW; Expense Ratio: 0.82%, Inception September 30, 2014) or ARK Autonomous Tech. & Robotics ETF (ARKQ; Expense Ratio: 0.75%, Inception: September 30, 2014). The performance used to represent each asset class reflects the net asset value (NAV) performance of each ETF for the time periods shown. Source: ARK Investment Management LLC, 2025, based on data and calculation from Morningstar, as of June 30, 2025. For informational purposes only and should not be considered investment advice or a recommendation to buy, sell, or hold any particular security. Past performance is not indicative of future results. Extraordinary performance is attributable in part due to unusually favorable market conditions and may not be repeated or consistently achieved in the future.
.png)
*Equity allocations are represented by the following: Domestic Equity: iShares Core S&P Total US Stock Market ETF (ITOT; Expense Ratio: 0.03%); International Equity (Ex US & Canada): iShares MSCI EAFE ETF (EFA; Expense Ratio: 0.32%); Emerging Markets: iShares MSCI Emerging Markets ETF (EEM; Expense Ratio: 0.70%); Artificial Intelligence (AI): ARK Next Generation Internet ETF (ARKW; Expense Ratio: 0.82%, Inception September 30, 2014) or ARK Autonomous Tech. & Robotics ETF (ARKQ; Expense Ratio: 0.75%, Inception: September 30, 2014). The performance used to represent each asset class reflects the net asset value (NAV) performance of each ETF for the time periods shown. Source: ARK Investment Management LLC, 2025, based on data and calculation from Morningstar, as of June 30, 2025. For informational purposes only and should not be considered investment advice or a recommendation to buy, sell, or hold any particular security. Past performance is not indicative of future results. Extraordinary performance is attributable in part due to unusually favorable market conditions and may not be repeated or consistently achieved in the future.
The Role Of AI & Cryptocurrency In Portfolio Optimization
ARKW offers a powerful mechanism for investors seeking both AI and cryptocurrency exposure. For example, from January 2015 through June 2025:
- A traditional 60/30/10 global equity portfolio produced a 10.6% return with a Sharpe ratio of 0.59.
- The Optimal Portfolio integrated up to 42% to ARKW, which achieved a return of 18.6% with a Sharpe ratio of 0.75.
What Is The Sharpe Ratio?
The Sharpe Ratio measures how much return an investor earns per unit of risk in their portfolio. A higher Sharpe Ratio indicates better risk-adjusted performance: investors are wringing the most reward from every unit of risk they take. In this way, the Sharpe Ratio complements the concept of the efficient frontier, which maps the highest possible return achievable for a given level of risk. Portfolios with higher Sharpe Ratios tend to lie closer to the efficient frontier, signaling that the investor is using diversification and allocation in the most efficient manner possible.
For investors seeking to future-proof their portfolios, these findings suggest that AI and cryptocurrency are essential building blocks in modern portfolio optimization. Moreover, even modest AI allocations (5%-15%) enhanced risk-adjusted returns, as shown below.
.png)
*Measurement of returns of a market against its risk (in this case, volatility). International Equity and Emerging Markets are calculated out of these optimal portfolios given their low participation in maximizing risk-adjusted returns relative to the other asset classes included in this table. Market representations: Domestic Equity: iShares Core S&P Total US Stock Market ETF (ITOT; Expense Ratio: 0.03%); International Equity (Ex US & Canada): iShares MSCI EAFE ETF (EFA; Expense Ratio: 0.32%); Emerging Markets: iShares MSCI Emerging Markets ETF (EEM; Expense Ratio: 0.70%); Artificial Intelligence (AI): ARK Next Generation Internet ETF (ARKW; Expense Ratio: 0.82%, Inception September 30, 2014) or ARK Autonomous Tech. & Robotics ETF (ARKQ; Expense Ratio: 0.75%, Inception: September 30, 2014). The performance used to represent each market reflects the net asset value (NAV) performance of each ETF/fund for the time periods shown. This simulation, also known as “efficient frontier”, is a set of theoretical investment portfolios expected to provide the highest returns at multiple levels of risk. The dots under the efficient frontier in the chart represent portfolios comprised of a single markets. January 2015 to June 2025 was used since this is the longest available time horizon for common inception across each ETF. Sources: ARK Investment Management LLC, 2025, based on data and calculation from PortfolioVisualizer.com, as of June 30, 2025. For informational purposes only and should not be considered investment advice or a recommendation to buy, sell, or hold any particular security or cryptocurrency. Past performance is not indicative of future results.
The Role Of AI & Robotics In Portfolio Optimization
For investors seeking AI exposure without cryptocurrency exposure, ARKQ provides targeted access to AI & robotics.
According to ARK’s analysis, from January 2015 through June 2025:
- The Optimal Portfolio incorporating ~26% allocation to AI & robotics (ARKQ) delivered a 13.8% return with a Sharpe ratio of 0.68.
- That performance compares favorably—and with only a moderate increase in volatility—to the 10.6% return and 0.59 Sharpe ratio of the traditional 60/30/10 portfolio.
Even modest AI allocations (5%-15%) enhanced risk-adjusted returns, as shown in the chart below.
.png)
*Measurement of returns of a market against its risk (in this case, volatility). International Equity and Emerging Markets are calculated out of these optimal portfolios given their low participation in maximizing risk-adjusted returns relative to the other asset classes included in this table. Market representations: Domestic Equity: iShares Core S&P Total US Stock Market ETF (ITOT; Expense Ratio: 0.03%); International Equity (Ex US & Canada): iShares MSCI EAFE ETF (EFA; Expense Ratio: 0.32%); Emerging Markets: iShares MSCI Emerging Markets ETF (EEM; Expense Ratio: 0.70%); Artificial Intelligence (AI): ARK Next Generation Internet ETF (ARKW; Expense Ratio: 0.82%, Inception September 30, 2014) or ARK Autonomous Tech. & Robotics ETF (ARKQ; Expense Ratio: 0.75%, Inception: September 30, 2014). The performance used to represent each market reflects the net asset value (NAV) performance of each ETF/fund for the time periods shown. This simulation, also known as “efficient frontier”, is a set of theoretical investment portfolios expected to provide the highest returns at multiple levels of risk. The dots under the efficient frontier in the chart represent portfolios comprised of a single markets. January 2015 to June 2025 was used since this is the longest available time horizon for common inception across each ETF. Sources: ARK Investment Management LLC, 2024, based on data and calculation from PortfolioVisualizer.com, as of June 30, 2025. For informational purposes only and should not be considered investment advice or a recommendation to buy, sell, or hold any particular security or cryptocurrency. Past performance is not indicative of future results.
For investors who want to benefit from innovation without exposure to cryptocurrency, AI and robotics present a compelling alternative that gives portfolios the potential to capture structural growth trends while balancing risk effectively.
Conclusion: Opportunities For Allocating To Artificial Intelligence
No longer a niche investment theme, artificial intelligence is an essential component of modern portfolio design. By adding ARKW or ARKQ, AI exposure can help investors:
- Optimize risk-adjusted returns
- Move closer to the efficient frontier
- Future-proof their portfolios in a rapidly evolving market
ARK encourages investors to work with their financial professionals to explore how these strategies can complement their broader asset allocation.
To learn more about ARKW and ARKQ, please read our Introduction To The ARK Next Generation Internet ETF (ARKW) and Introduction To The ARK Autonomous Tech. & Robotics ETF (ARKQ) blogs.
Important Information
Neither ARKW nor ARKQ hold cryptocurrencies directly.
Investors should carefully consider the investment objectives and risks as well as charges and expenses of an ARK ETF before investing. This and other information are contained in the ARK ETFs’ prospectuses and summary prospectuses, which may be obtained by visiting www.ark-funds.com. The prospectus and summary prospectus should be read carefully before investing.
Investing in securities involves risk and there's no guarantee of principal.
Fund Risks: The principal risks of investing in the ARKW include: Equity Securities Risk. The value of the equity securities the Fund holds may fall due to general market and economic conditions. Information Technology Sector Risk. The information technology sector includes companies engaged in internet software and services, technology hardware and storage peripherals, electronic equipment instruments and components, and semiconductors and semiconductor equipment. Information technology companies face intense competition, both domestically and internationally, which may have an adverse effect on profit margins. Information technology companies may have limited product lines, markets, financial resources or personnel. The products of information technology companies may face rapid product obsolescence due to technological developments and frequent new product introduction, unpredictable changes in growth rates and competition for the services of qualified personnel. Failure to introduce new products, develop and maintain a loyal customer base, or achieve general market acceptance for their products could have a material adverse effect on a company’s business. Companies in the information technology sector are heavily dependent on intellectual property and the loss of patent, copyright and trademark protections may adversely affect the profitability of these companies These companies may also be exposed to risks applicable to sectors other than the disruptive innovation theme for which they are chosen. Disruptive Innovation Risk. Companies that ARK believes are capitalizing on disruptive innovation and developing technologies to displace older technologies or create new markets may not in fact do so. Companies that initially develop a novel technology may not be able to capitalize on the technology. Companies that develop disruptive technologies may face political or legal attacks from competitors, industry groups or local and national governments. These companies may also be exposed to risks applicable to sectors other than the disruptive innovation theme for which they are chosen, and the securities issued by these companies may underperform the securities of other companies that are primarily focused on a particular theme.
Cryptocurrency Risk. Cryptocurrency (notably, bitcoin), often referred to as ‘‘virtual currency’’ or ‘‘digital currency,’’ operates as a decentralized, peer-to-peer financial exchange and value storage that is used like money. The Fund may have exposure to bitcoin, a cryptocurrency, indirectly through an investment in the Bitcoin Investment Trust (‘‘GBTC’’), a privately offered, open-end investment vehicle. Cryptocurrency operates without central authority or banks and is not backed by any government. Even indirectly, cryptocurrencies may experience very high volatility and related investment vehicles like GBTC may be affected by such volatility. As a result of holding cryptocurrency, the Fund may also trade at a significant premium to NAV. Cryptocurrency is also not legal tender. Federal, state or foreign governments may restrict the use and exchange of cryptocurrency, and regulation in the U.S. is still developing. Cryptocurrency exchanges may stop operating or permanently shut down due to fraud, technical glitches, hackers or malware. Detailed information regarding the specific risks of ARKW ETF can be found in the prospectus. Additional risks of investing in ARKW include foreign securities, market, management and non-diversification risks, as well as fluctuations in market value and NAV.
The Fund’s exposure to cryptocurrency may change over time and, accordingly, such exposure may not always be represented in the Fund’s portfolio. Many significant aspects of the U.S. federal income tax treatment of investments in bitcoin are uncertain and an investment in bitcoin may produce income that is not treated as qualifying income for purposes of the income test applicable to regulated investment companies, such as the Fund. GBTC is expected to be treated as a grantor trust for U.S. federal income tax purposes, and therefore an investment by the Fund in GBTC will generally be treated as a direct investment in bitcoin for such purposes. See ‘‘Taxes’’ in the Fund’s SAI for more information.
The principal risks of investing in ARKQ: Equity Securities Risk. The value of the equity securities the Fund holds may fall due to general market and economic conditions. Foreign Securities Risk. Investments in the securities of foreign issuers involve risks beyond those associated with investments in U.S. securities. Consumer Discretionary Risk. Companies in this sector may be adversely impacted by changes in domestic/international economies, exchange/interest rates, social trends and consumer preferences." Information Technology Sector Risk. Companies may face rapid product obsolescence due to technological developments and frequent new product introduction, unpredictable changes in growth rates and competition for the services of qualified personnel. Detailed information regarding the specific risks of ARKQ ETF can be found in the prospectus. Industrials Sector Risk. Companies in the industrials sector may be adversely affected by changes in government regulation, world events and economic conditions. In addition, companies in the industrials sector may be adversely affected by environmental damages, product liability claims and exchange rates. Disruptive Innovation Risk. Companies that ARK believes are capitalizing on disruptive innovation and developing technologies to displace older technologies or create new markets may not in fact do so. Companies that initially develop a novel technology may not be able to capitalize on the technology. Companies that develop disruptive technologies may face political or legal attacks from competitors, industry groups or local and national governments. These companies may also be exposed to risks applicable to sectors other than the disruptive innovation theme for which they are chosen, and the securities issued by these companies may underperform the securities of other companies that are primarily focused on a particular theme.
Additional risks of investing in ARKQ or ARKW include market, management and non-diversification risks, as well as fluctuations in market value and NAV.
Shares of ARKW and ARKQ are bought and sold at market price (not NAV) and are not individually redeemed from the ETF. ETF shares may only be redeemed directly with the ETF at NAV by Authorized Participants, in very large creation units. There can be no guarantee that an active trading market for ETF shares will develop or be maintained, or that their listing will continue or remain unchanged. Buying or selling ETF shares on an exchange may require the payment of brokerage commissions and frequent trading may incur brokerage costs that detract significantly from investment returns
Portfolio holdings will change and should not be considered as investment advice or a recommendation to buy, sell or hold any particular security. Please visit www.ark-funds.com for the most current list of holdings for the ARK ETFs.
The information herein is general in nature and should not be considered financial, legal or tax advice. An investor should consult a financial professional, an attorney or tax professional regarding the investor’s specific situation. Certain information was obtained from sources that ARK believes to be reliable; however, ARK does not guarantee the accuracy or completeness of any information obtained from any third party.
ARK Investment Management LLC is the investment adviser to the ARK ETFs.
Foreside Fund Services, LLC, distributor.
Ganti, A. 2025. “Efficient Frontier: What It Is and How Investors Use It.” Investopedia.
In finance, standard deviation is a statistical measure that quantifies the degree to which an investment's returns fluctuate around its average or mean return over a specific period. It essentially indicates the volatility of an investment, with a higher standard deviation signifying greater price fluctuations and higher risk, and a lower standard deviation indicating more stable prices and lower risk.
ARK’s statements are not an endorsement of any company or a recommendation to buy, sell or hold any security. ARK and its clients as well as its related persons may (but do not necessarily) have financial interests in securities or issuers that are discussed. Certain of the statements contained may be statements of future expectations and other forward-looking statements that are based on ARK’s current views and assumptions and involve known and unknown risks and uncertainties that could cause actual results, performance, or events to differ materially from those expressed or implied in such statements.
Explore ARK Funds
Featured Funds:
ARK Trade Notifications
ARK offers fully transparent Exchange Traded Funds (“ETFs”) and provides investors with trade information for all actively managed ETFs.
