


In an article ARK published in August 2025—Investing In The Future: How An AI-Themed ETF Could Strengthen Equity Portfolios—we used empirical data and efficient frontier analysis to examine how exposure to artificial intelligence historically may have improved portfolio efficiency. The study demonstrated that allocating to AI strategies may have meaningfully enhanced returns without increasing risk proportionally across multiple market cycles.
Since then, both the data and the AI landscape have continued to evolve rapidly. Now, we offer investors an updated portfolio optimization analysis through December 31, 2025. The time is right for this, given accelerating changes in AI cost structures, adoption, and monetization. We believe it is worth revisiting the conclusions of our previous research in the context of what has changed and what we now know is reinforcing our original findings.
This follow-up builds on the same analytical framework, incorporating nearly a decade of market data alongside new insights into the current AI investment cycle. In our view, the latest evidence not only supports the role of AI in portfolio construction but also strengthens the case for AI as an increasingly important driver of long-term, risk-adjusted returns.
How Artificial Intelligence Has Improved Portfolio Efficiency
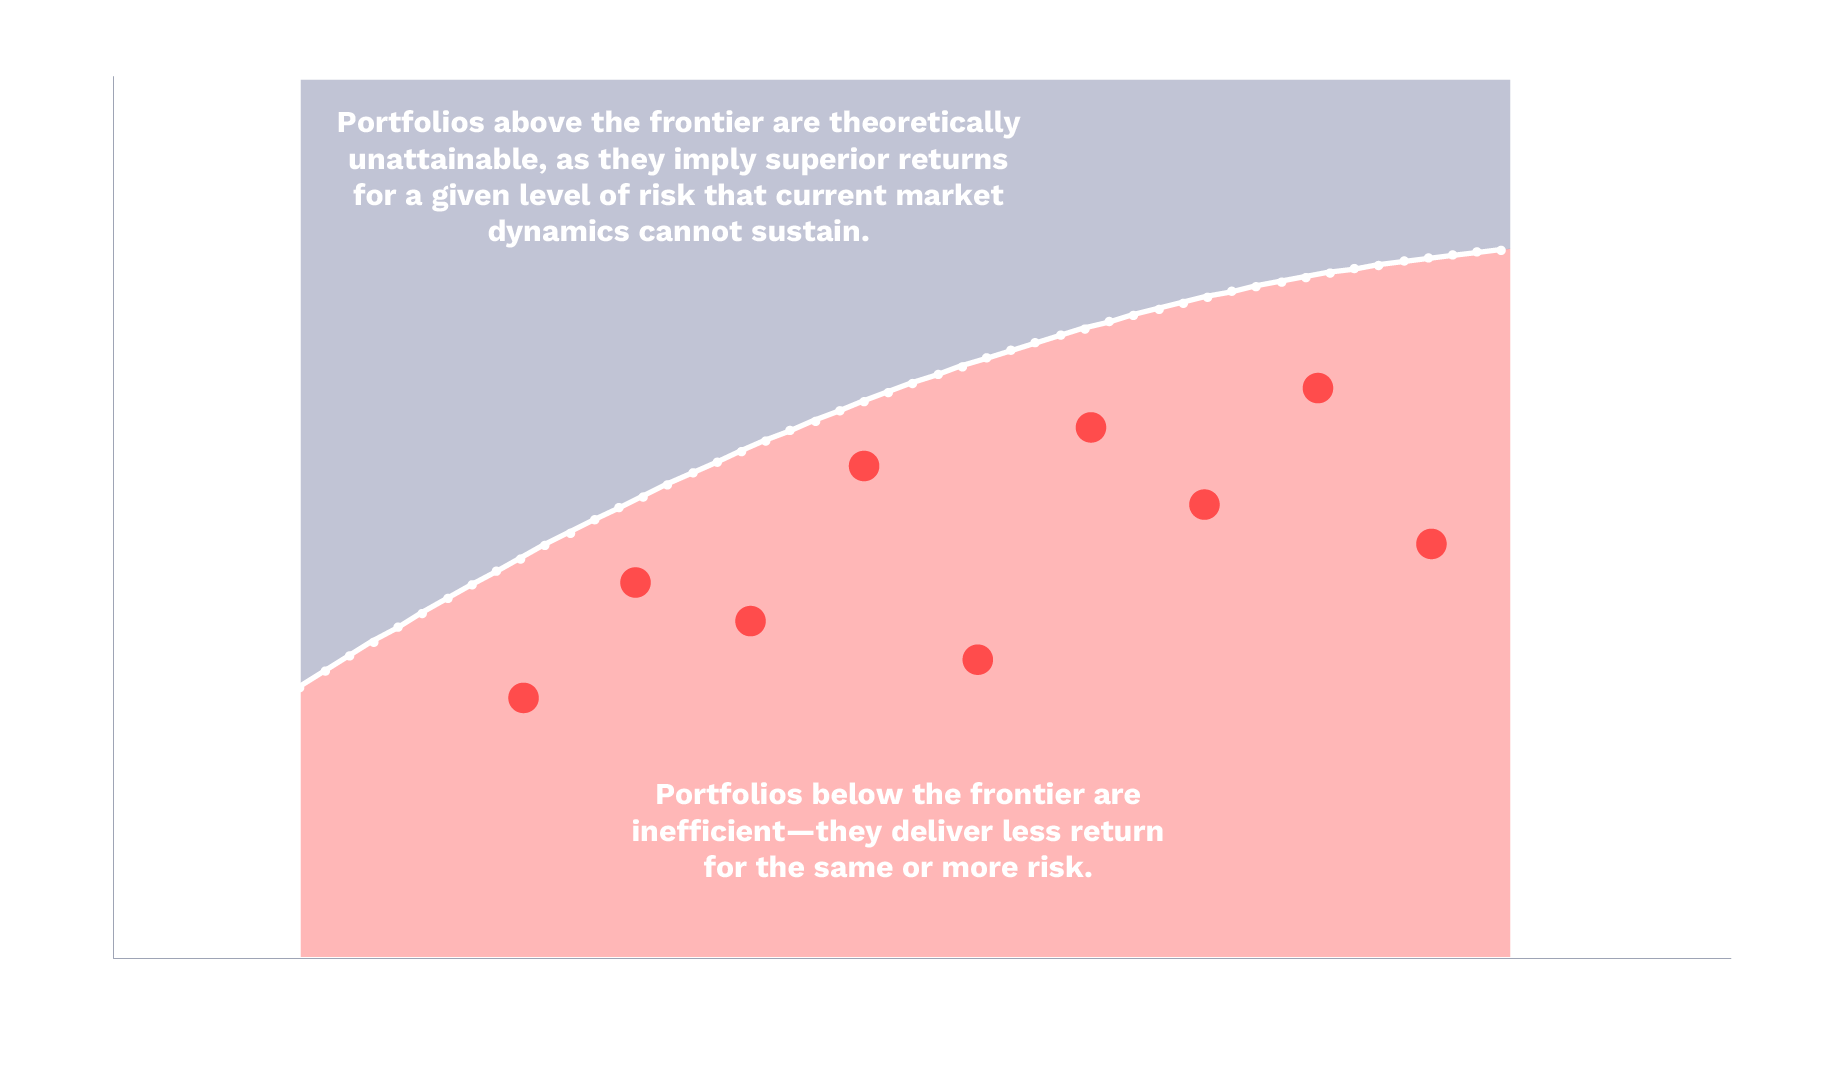
The efficient frontier illustrates the highest return an investor can expect for each level of risk. Portfolios below the frontier are inefficient, delivering less return for the same volatility, while portfolios on the frontier make optimal use of risk.
Diversification does not ensure a profit and does not protect against loss, particularly in a down market.
Using a hypothetical global equity reference portfolio—60% US equity, 30% international developed equity, and 10% emerging markets—ARK analyzed how incremental allocations to artificial intelligence might have affected portfolio outcomes from January 2015 through December 2025. AI exposure was represented by the ARK Next Generation Internet ETF (ARKW) or the ARK Autonomous Technology & Robotics ETF (ARKQ). Within this framework, an optimal portfolio is defined as one that lies on the efficient frontier—it delivers the highest expected return for a given level of risk. Our analysis evaluates how AI allocations may have shifted portfolios toward more optimal outcomes.
We believe this comparative structure will help investors understand how incremental allocations to AI can potentially enhance performance while preserving diversification. A chart illustrating the relative allocations of these hypothetical model portfolios is shown below.
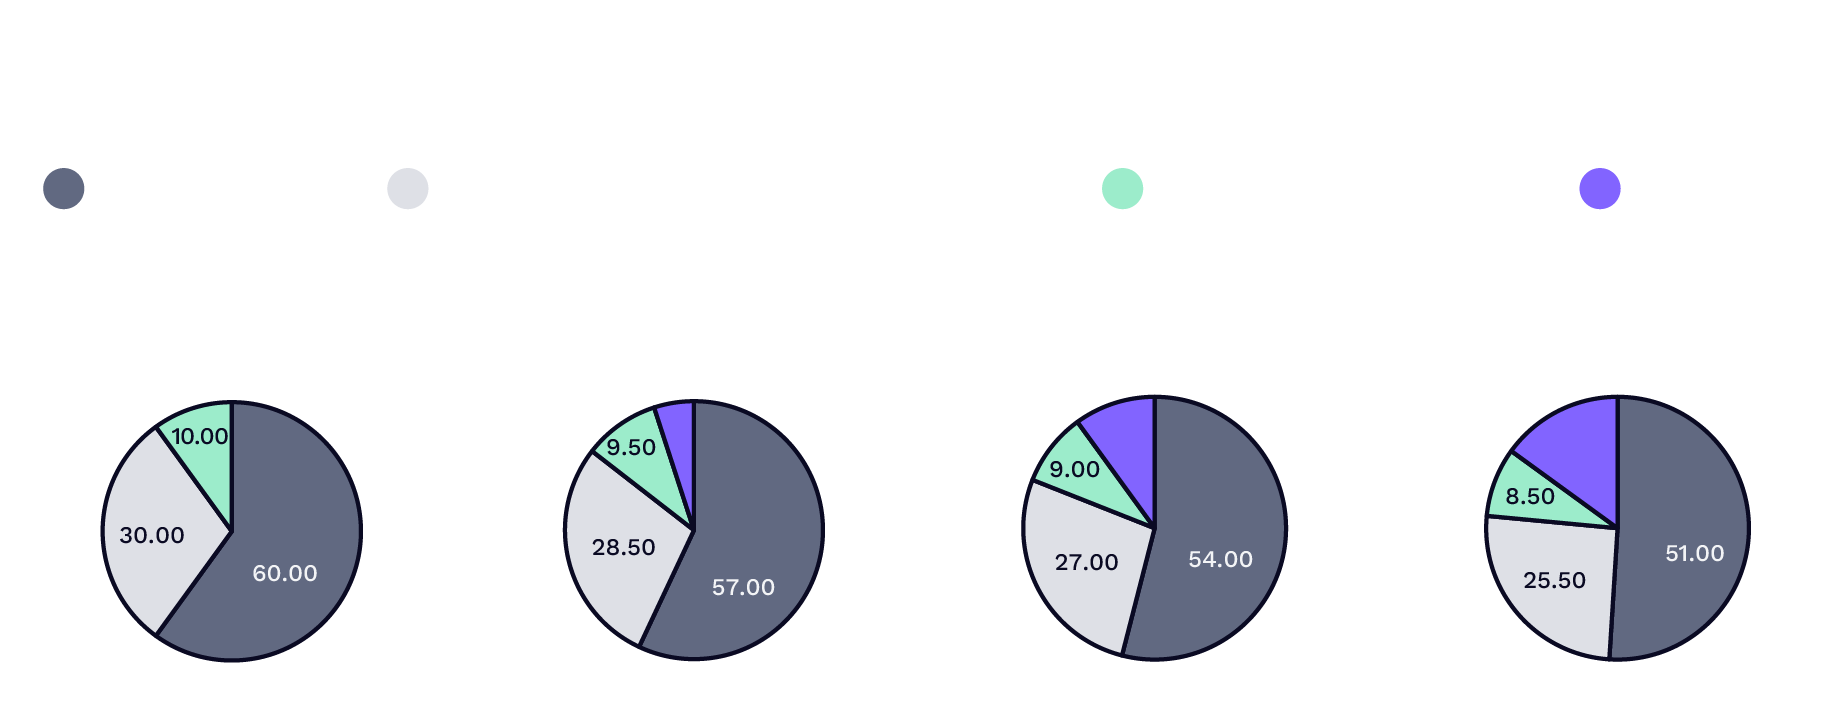
Parts of A Global Equity Model Portfolio
| As of December 31, 2025 | 3 Months | YTD | 1 Year* | 3 Years* | 5 Years* | 10 Years* | Since Inception* |
| Representation: US Market | |||||||
| Net Returns Since Inception (Jan. 23, 2004) | |||||||
| ITOT NAV | 2.36% | 17.02% | 17.02% | 22.23% | 13.06% | 14.20% | 10.36% |
| ITOT Market Price | 2.42% | 17.00% | 17.00% | 22.23% | 13.08% | 14.20% | 10.38% |
| Representation: International Developed Market (Ex US) | |||||||
| Net Returns Since Inception (Aug. 17, 2001) | |||||||
| EFA NAV | 4.33% | 31.38% | 31.38% | 17.05% | 8.87% | 8.14% | 6.21% |
| EFA Market Price | 4.72% | 31.55% | 31.55% | 17.24% | 9.00% | 8.24% | 6.26% |
| Representation: Emerging Markets | |||||||
| Net Returns Since Inception (Apr. 11, 2003) | |||||||
| EEM NAV | 4.32% | 33.34% | 33.34% | 15.78% | 3.50% | 7.73% | 9.28% |
| EEM Market Price | 3.93% | 33.98% | 33.98% | 15.84% | 3.55% | 7.81% | 9.36% |
| Representation: Artificial Intelligence (AI) | |||||||
| Net Returns Since Inception (Sep. 30, 2014) | |||||||
| ARKW NAV | -13.99% | 38.69% | 38.69% | 57.17% | 1.04% | 22.82% | 21.84% |
| ARKW Market Price | -14.08% | 38.93% | 38.93% | 57.23% | 1.05% | 22.76% | 21.82% |
| ARKQ NAV | 3.03% | 48.70% | 48.70% | 40.88% | 8.73% | 20.37% | 17.62% |
| ARKQ Market Price | 3.05% | 48.81% | 48.81% | 40.96% | 8.71% | 20.32% | 17.62% |
ARK selected a single fund manager as the consistent brand to represent the broad US market, international developed markets, and emerging markets respectively so as not to imply ARK conducted due diligence among several or many fund managers. ARK selected Blackrock, and their brand iShares specifically because iShares is one of the largest, most respected, and most trusted passive ETF providers globally that historically offers low tracking error to target exposure, has low fees relative to the industry, and has high liquidity given their scale. This research and report is a hypothetical experiment conducted to understand if an artificial intelligence strategy, as represented by the ARK Next Generation Internet ETF (ARKW) or ARK Autonomous Tech. & Robotics ETF (ARKQ), is value accretive in a total equity portfolio.
For informational purposes only and should not be considered investment advice, or a recommendation to buy, sell or hold any particular security. Past performance does not guarantee future results. The performance data quoted represents past performance and current returns may be lower or higher. The investment return and principal will fluctuate so that an investor's shares when redeemed may be worth more or less than the original cost. For the Fund’s most recent month end performance, please visit www.ark-funds.com or call 212.426.7040. Returns for less than one year are not annualized. As stated in the ARK ETFs' current prospectuses, the expense ratio for ARKW is 0.76% and for ARKQ is 0.75%.
Extraordinary performance is attributable in part due to unusually favorable market conditions and may not be repeated or consistently achieved in the future.
For the most recent month end performance for ITOT, EEM, and EFA visit www.ishares.com or call 1-800-474-2737
Additional information about fees and expense levels can be found in the ARK ETFs' prospectuses. Net asset value (“NAV”) returns are based on the dollar value of a single share of an ARK ETF, calculated using the value of the underlying assets of the ARK ETF minus its liabilities, divided by the number of shares outstanding. The NAV is typically calculated at 4:00 pm Eastern time. Market returns are based on the trade price at which shares are bought and sold on the exchange using the last share trade. Market performance does not represent the returns you would receive if you traded shares at other times. Total Return reflects reinvestment of distributions on ex-date for NAV returns and payment date for Market Price returns. The market price of ARK ETF shares may differ significantly from their NAV during periods of market volatility. ARK's actively managed ETFs are benchmark agnostic. Index performance provided as a general market indicator.
Source: ARK Investment Management LLC. Data Source: Bloomberg. Note following market representations: US Market: iShares Core S&P Total US Stock Market ETF (ITOT; Fee: 0.03%); International Developed Market (Ex US) : iShares MSCI EAFE ETF (EFA; Fee: 0.32%); Emerging Markets: iShares MSCI Emerging Markets ETF (EEM; Fee: 0.70%); Artificial Intelligence (AI): ARK Next Generation Internet ETF (ARKW; Expense Ratio: 0.76%, Inception September 30, 2014) or ARK Autonomous Tech. & Robotics ETF (ARKQ; Expense Ratio: 0.75%, Inception: September 30, 2014).
Across multiple allocation levels, adding exposure to AI, hypothetically on a backward looking basis, consistently shifted portfolios toward a more favorable position on the efficient frontier, improving returns more than volatility increased.
What The Data Revealed
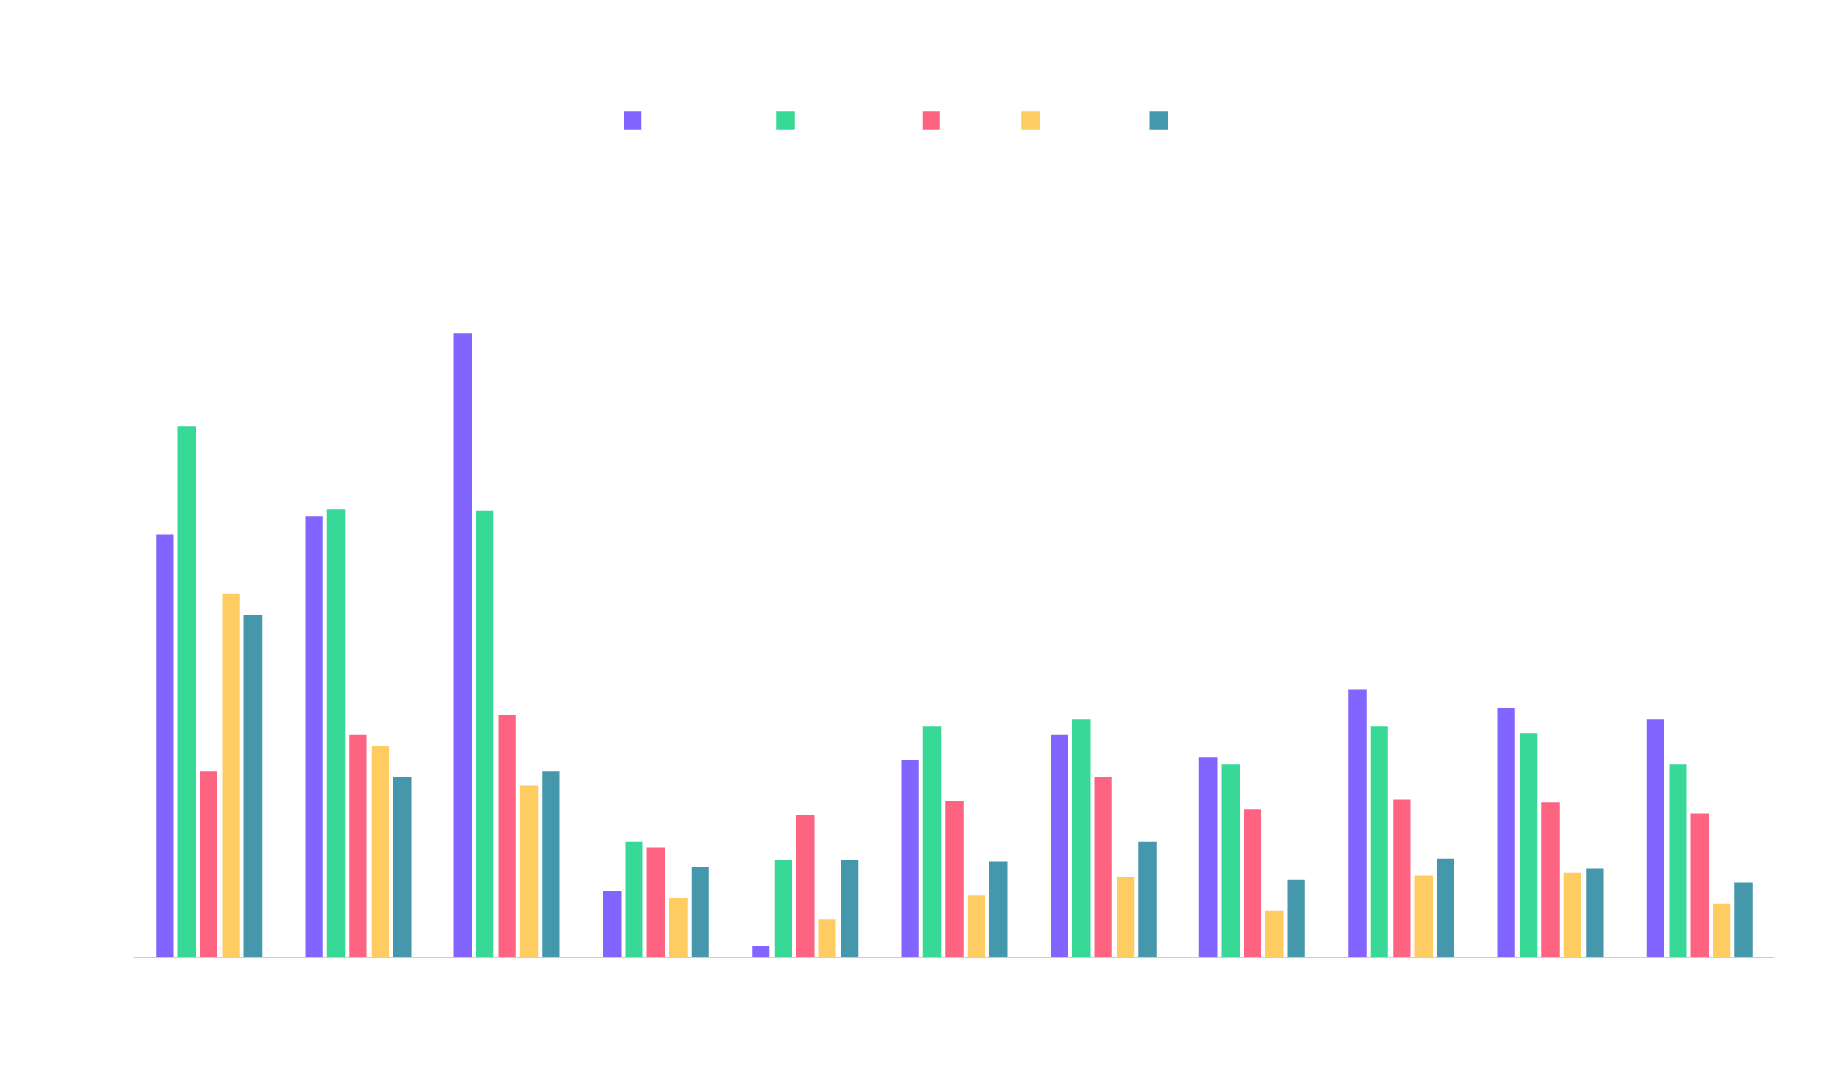
ARK’s analysis demonstrates that both the ARK Next Generation Internet ETF (ARKW) and the ARK Autonomous Tech. & Robotics ETF (ARKQ) have outperformed traditional equity allocations across multiple time horizons and with remarkable consistency. Specifically, since their inception, from September 30, 2014, through December 31, 2025:
- ARKW returned 21.84% annually
- ARKQ returned 17.62% annually
- By comparison:
- US equities returned 10.36% annually
- Developed international markets returned 6.21% annually
- Emerging market returned 9.28% annually
Importantly, the outperformance of ARKW and ARKQ spanned multiple market cycles, highlighting the resilience and growth potential of AI strategies in a diversified portfolio. The chart below illustrates how their focus on AI—and other innovation platforms that AI catalyzes, including robotics, digital infrastructure, and other related technologies—consistently generated ARKW’s and ARKQ’s outperformance relative to broad-market benchmarks.
*Equity allocations are represented by the following: Domestic Equity: iShares Core S&P Total US Stock Market ETF (ITOT; Expense Ratio: 0.03%); International Equity (Ex US & Canada): iShares MSCI EAFE ETF (EFA; Expense Ratio: 0.32%); Emerging Markets: iShares MSCI Emerging Markets ETF (EEM; Expense Ratio: 0.70%); Artificial Intelligence (AI): ARK Next Generation Internet ETF (ARKW; Expense Ratio: 0.76%, Inception September 30, 2014) or ARK Autonomous Tech. & Robotics ETF (ARKQ; Expense Ratio: 0.75%, Inception: September 30, 2014). The performance used to represent each asset class reflects the net asset value (NAV) performance of each ETF for the time periods shown. Source: ARK Investment Management LLC, 2025, based on data and calculation from Morningstar, as of December 31, 2025. For informational purposes only and should not be considered investment advice or a recommendation to buy, sell, or hold any particular security. Past performance is not indicative of future results. Extraordinary performance is attributable in part due to unusually favorable market conditions and may not be repeated or consistently achieved in the future.
From January 2015 to December 2025, the traditional 60/30/10 portfolio produced an annualized return of 11.2% with a standard deviation of 14.5%, resulting in a Sharpe ratio of 0.63.
What Is The Sharpe Ratio?
The Sharpe Ratio measures how much return an investor earns per unit of risk in their portfolio. A higher Sharpe Ratio indicates better risk-adjusted performance: investors are wringing the most reward from every unit of risk they take. In this way, the Sharpe Ratio complements the concept of the efficient frontier, which maps the highest possible return achievable for a given level of risk. Portfolios with higher Sharpe Ratios tend to lie closer to the efficient frontier, signaling that the investor is using diversification and allocation in the most efficient manner possible.
Introducing AI exposure improved outcomes meaningfully, as elucidated in the following examples.
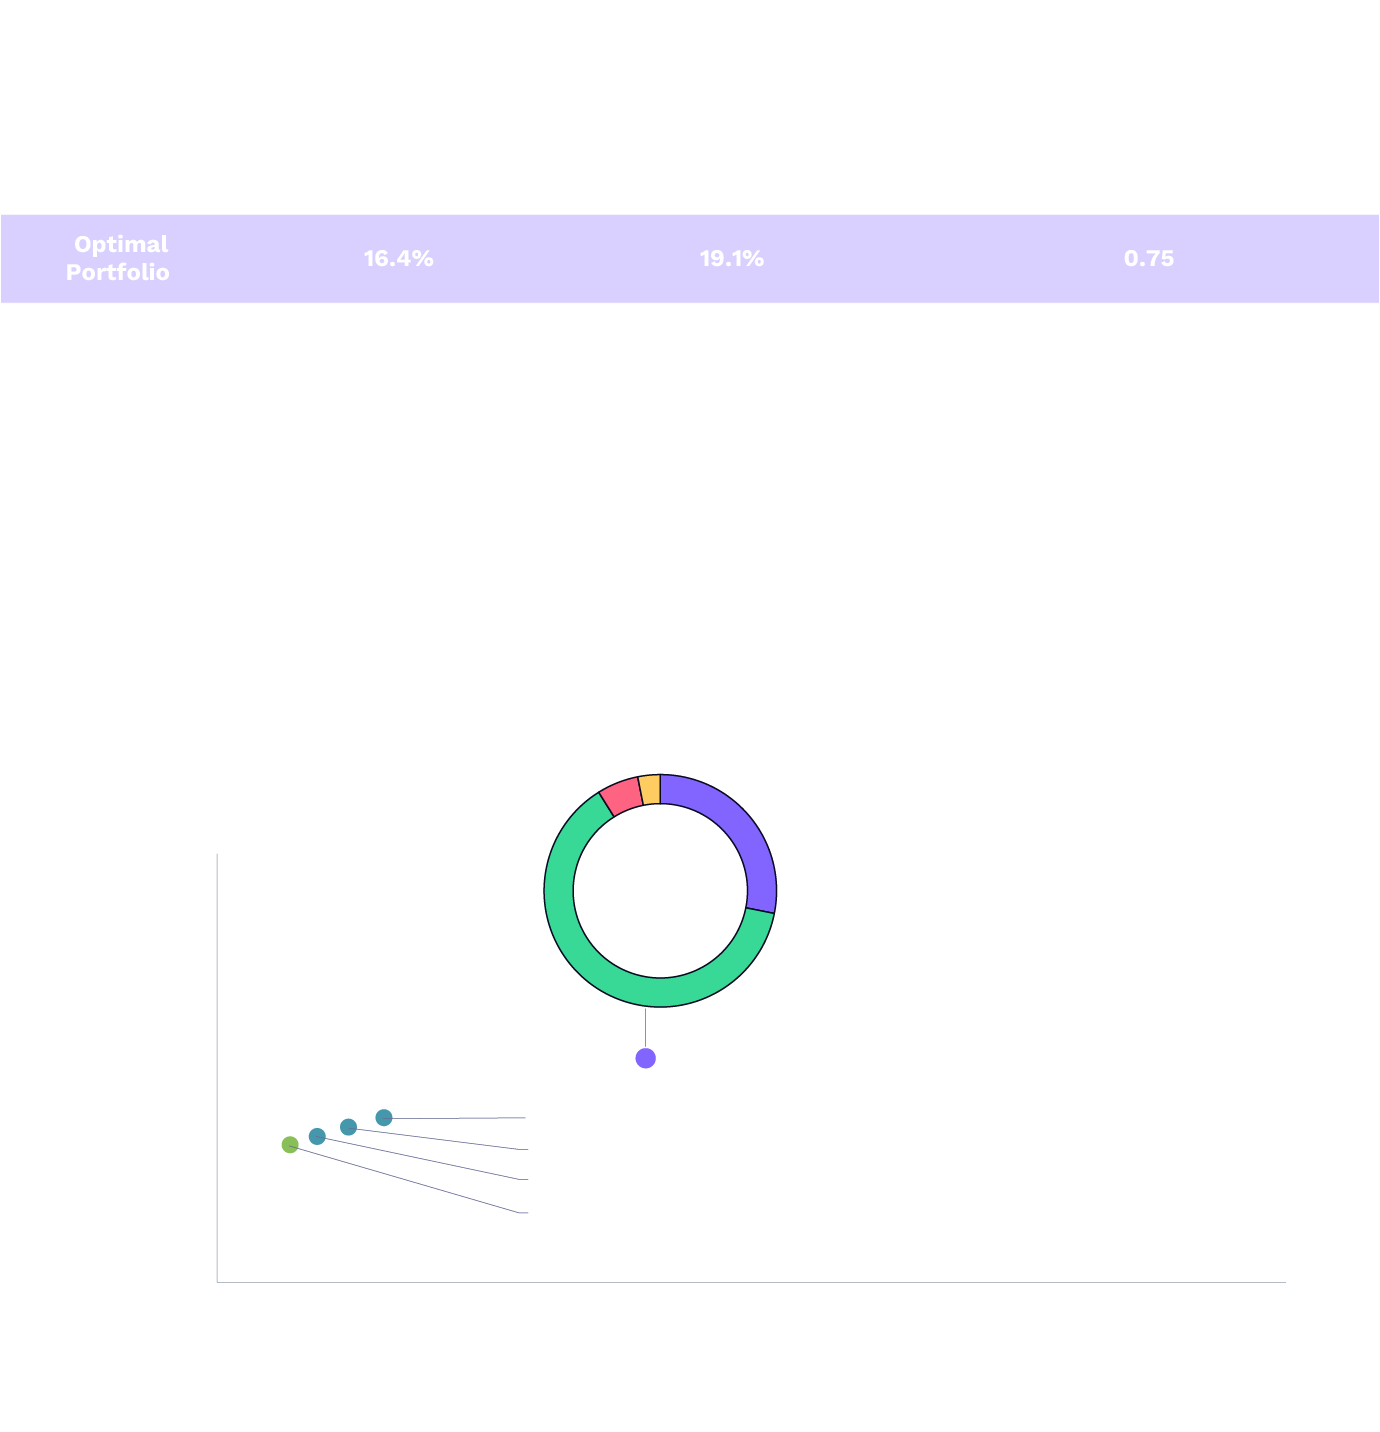
- ARKW offers a powerful mechanism for investors seeking both AI and cryptocurrency exposure. For example, from January 2015 through December 2025:
- The Optimal Portfolio allocated up to 28% to ARKW, which achieved a return of 16.4% with a Sharpe ratio of 0.75.
- For investors seeking to future-proof their portfolios, these findings suggest that AI and cryptocurrency are essential building blocks in modern portfolio optimization. Moreover, even modest AI allocations (5%-15%) enhanced risk-adjusted returns, as shown below.
Note: International Equity and Emerging Markets are calculated out of these optimal portfolios given their low participation in maximizing risk-adjusted returns relative to the other asset classes included in this table. Market representations: Domestic Equity: iShares Core S&P Total US Stock Market ETF (ITOT; Expense Ratio: 0.03%); International Equity (Ex US & Canada): iShares MSCI EAFE ETF (EFA; Expense Ratio: 0.32%); Emerging Markets: iShares MSCI Emerging Markets ETF (EEM; Expense Ratio: 0.70%); Artificial Intelligence (AI): ARK Next Generation Internet ETF (ARKW; Expense Ratio: 0.76%, Inception September 30, 2014). The performance used to represent each market reflects the net asset value (NAV) performance of each ETF/fund for the time periods shown. This simulation, also known as “efficient frontier”, is a set of theoretical investment portfolios expected to provide the highest returns at multiple levels of risk. January 2015 to December 2025 was used since this is the longest available time horizon for common inception across each ETF. The hypothetical portfolios were not periodically rebalanced for this analysis. Sources: ARK Investment Management LLC, 2025, based on data and calculation from PortfolioVisualizer.com, as of December 31, 2025. For informational purposes only and should not be considered investment advice or a recommendation to buy, sell, or hold any particular security or cryptocurrency. Past performance is not indicative of future results.
- For investors seeking AI exposure without cryptocurrency exposure, ARKQ provided targeted access to AI & robotics. According to ARK’s analysis, from January 2015 through December 2025:
- The Optimal Portfolio integrated up to 30% to ARKQ, which achieved returns of 14.8% with a Sharpe Ratio of 0.73.
- Even modest AI allocations (5%-15%) enhanced risk-adjusted returns, as shown in the chart below.
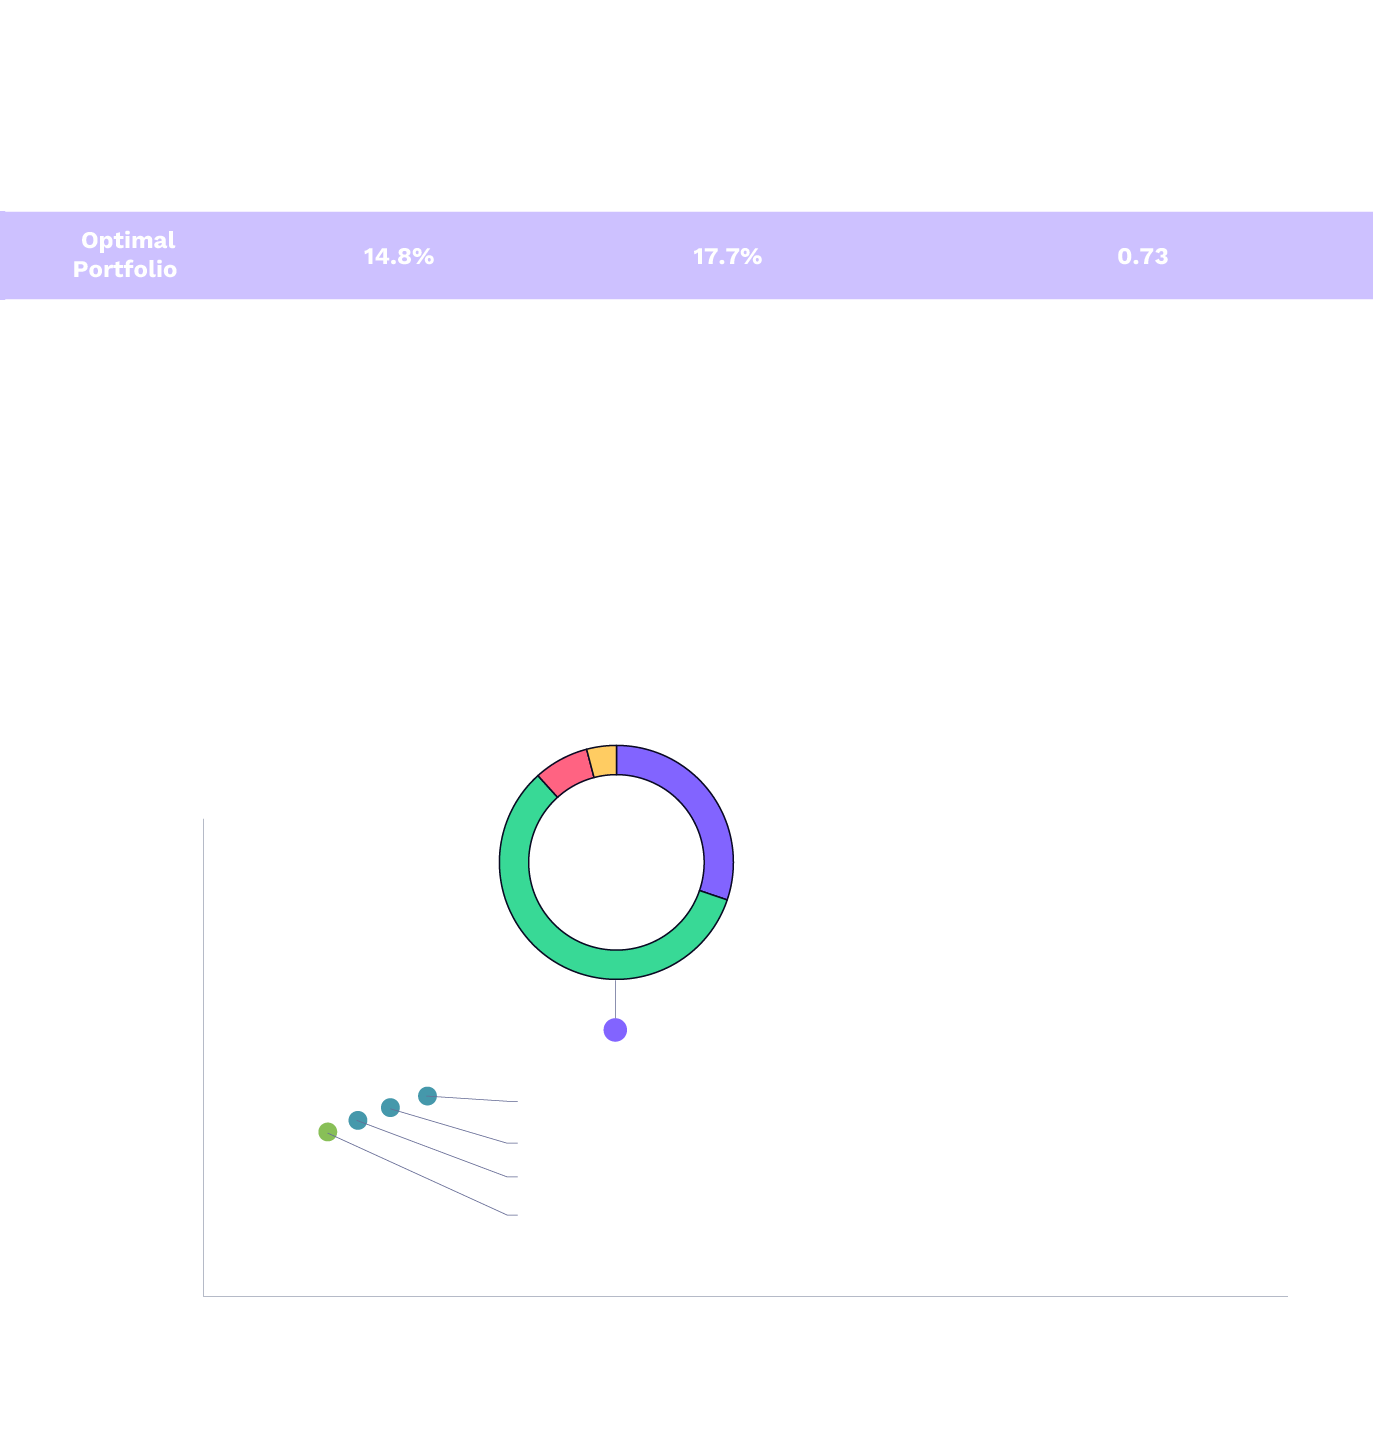
Note: International Equity and Emerging Markets are calculated out of these optimal portfolios given their low participation in maximizing risk-adjusted returns relative to the other asset classes included in this table. Market representations: Domestic Equity: iShares Core S&P Total US Stock Market ETF (ITOT; Expense Ratio: 0.03%); International Equity (Ex US & Canada): iShares MSCI EAFE ETF (EFA; Expense Ratio: 0.32%); Emerging Markets: iShares MSCI Emerging Markets ETF (EEM; Expense Ratio: 0.70%); Artificial Intelligence (AI): ARK Autonomous Tech & Robotics ETF (ARKQ; Expense Ratio: 0.75%, Inception: September 30, 2014). The performance used to represent each market reflects the net asset value (NAV) performance of each ETF/fund for the time periods shown. This simulation, also known as “efficient frontier”, is a set of theoretical investment portfolios expected to provide the highest returns at multiple levels of risk. January 2015 to December 2025 was used since this is the longest available time horizon for common inception across each ETF. The hypothetical portfolios were not periodically rebalanced for this analysis. Sources: ARK Investment Management LLC, 2025, based on data and calculation from PortfolioVisualizer.com, as of December 31, 2025. For informational purposes only and should not be considered investment advice or a recommendation to buy, sell, or hold any particular security or cryptocurrency. Past performance is not indicative of future results.
- Importantly, these are risk-adjusted metrics. While ARK’s AI strategies may have exhibited higher standalone volatility historically, adding them in combination did not raise overall portfolio risk to an inefficient level; instead, the diversification benefits helped keep total risk in check while improving the portfolio’s risk-adjusted return. The risk-aware optimal allocations therefore included meaningful weights to ARK’s AI strategies, supported both by their historical return profile and by their differentiation versus traditional benchmarks and strategies, including low overlap with conventional exposures.
Why AI Has Shifted The Frontier
In ARK’s view, AI’s contribution to portfolio efficiency reflects both potential for return and structural diversification. Artificial intelligence is not a single industry; it is a horizontal technology layer simultaneously transforming cloud computing, semiconductors, robotics, digital commerce, autonomous systems, and financial infrastructure.
As a result, AI-focused portfolios draw returns from multiple innovation cycles at once, often driven by productivity gains instead of macroeconomic growth. This helps explain why AI exposure historically has enhanced returns without proportionally increasing volatility in our hypothetical analysis.
The Current AI Landscape: Costs, Demand, And Monetization
Today’s AI environment strengthens this conclusion. One of the most important signals is the pace of cost declines. Depending on the benchmark, the cost of AI inference has fallen by as much as 99% year-over-year,1 while training costs have declined roughly 75% annually2—far faster than historical semiconductor cost curves as captured in Moore’s Law. In ARK’s experience, sustained cost declines of this magnitude often indicate that a technology is moving from experimentation toward broad economic deployment.
Crucially, falling costs are expanding demand, not reducing it. Token consumption—a proxy for digital intelligence delivered—has increased developer platforms more than 25-fold since late 2024,3 reflecting how lower costs unlock new use cases and deeper integration into workflows.
At the infrastructure level, global data-center system spending has accelerated from ~$150–$200 billion annually prior to generative AI to ~$500 billion in 2025, with estimates approaching ~$580 billion in 2026.4 In ARK’s view, that spending reflects real demand driven by AI workloads that require accelerated computing. Our research suggests that none of this is speculative excess.
Addressing Bubble Concerns
Our research suggests that the current cycle differs in important ways from technology bubbles. AI-driven capital expenditure (CapEx) is being funded largely by highly profitable hyperscalers, with CapEx representing a materially lower percentage of operating cash flow than during the late-1990s tech-and-telecom cycle. At the same time, valuation multiples—both for today’s large technology companies and for the broader market—remain below the bubble peaks of the past, despite their meaningfully stronger margins and cash generation today.
In our view, this combination of falling unit costs, accelerating revenues, and disciplined funding sources supports the durability of the current AI investment cycle.
From Infrastructure To Revenue
Beyond infrastructure, monetization is becoming increasingly visible across both consumer and enterprise markets. On the consumer side, generative AI is emerging as a new operating system, with adoption occurring faster than that which occurred during the early internet era. AI chatbots already have reached nearly 20% the penetration of smartphone users in just three years, compared to seven years for the internet, and are beginning to monetize not only through subscriptions but also through commerce and advertising.
On the enterprise side, rapid improvements in model capability are enabling AI to automate longer, more complex tasks, driving measurable productivity gains. Studies suggest that knowledge workers save close to an hour per day using AI tools—far exceeding the cost of subscription pricing—supporting continued adoption and revenue growth for AI platforms.
Implications For Portfolio Construction
Taken together, we believe the case for AI exposure in diversified portfolios has strengthened. Nearly a decade of historical data reveal that AI allocations improved risk-adjusted returns; and today’s fundamentals—rapid cost declines, accelerating adoption, visible monetization, and expanding end markets—suggest that AI remains early in its economic lifecycle.
From a portfolio-construction perspective, investors should rethink the view that artificial intelligence is only a tactical allocation or thematic satellite. Increasingly, the technology represents a foundational growth driver capable of improving long-term portfolio efficiency when thoughtfully integrated.
Indeed, what began as a hypothesis has become an undeniable empirical observation: AI has shifted the efficient frontier. In our view, it will continue to do so.
To learn more about ARKW and ARKQ, please read our Introduction To The ARK Next Generation Internet ETF (ARKW) and Introduction To The ARK Autonomous Tech. & Robotics ETF (ARKQ) blogs.
Important Information
Neither ARKW nor ARKQ hold cryptocurrencies directly.
Investors should carefully consider the investment objectives and risks as well as charges and expenses of an ARK ETF before investing. This and other information are contained in the ARK ETFs’ prospectuses and summary prospectuses, which may be obtained by visiting www.ark-funds.com. The prospectus and summary prospectus should be read carefully before investing.
Investing in securities involves risk and there's no guarantee of principal.
Fund Risks: The principal risks of investing in the ARKW include: Equity Securities Risk. The value of the equity securities the Fund holds may fall due to general market and economic conditions. Information Technology Sector Risk. The information technology sector includes companies engaged in internet software and services, technology hardware and storage peripherals, electronic equipment instruments and components, and semiconductors and semiconductor equipment. Information technology companies face intense competition, both domestically and internationally, which may have an adverse effect on profit margins. Information technology companies may have limited product lines, markets, financial resources or personnel. The products of information technology companies may face rapid product obsolescence due to technological developments and frequent new product introduction, unpredictable changes in growth rates and competition for the services of qualified personnel. Failure to introduce new products, develop and maintain a loyal customer base, or achieve general market acceptance for their products could have a material adverse effect on a company’s business. Companies in the information technology sector are heavily dependent on intellectual property and the loss of patent, copyright and trademark protections may adversely affect the profitability of these companies These companies may also be exposed to risks applicable to sectors other than the disruptive innovation theme for which they are chosen. Disruptive Innovation Risk. Companies that ARK believes are capitalizing on disruptive innovation and developing technologies to displace older technologies or create new markets may not in fact do so. Companies that initially develop a novel technology may not be able to capitalize on the technology. Companies that develop disruptive technologies may face political or legal attacks from competitors, industry groups or local and national governments. These companies may also be exposed to risks applicable to sectors other than the disruptive innovation theme for which they are chosen, and the securities issued by these companies may underperform the securities of other companies that are primarily focused on a particular theme.
Cryptocurrency Risk. Cryptocurrency (notably, bitcoin), often referred to as ‘‘virtual currency’’ or ‘‘digital currency,’’ operates as a decentralized, peer-to-peer financial exchange and value storage that is used like money. The Fund may have exposure to bitcoin, a cryptocurrency, indirectly through an investment in the Bitcoin Investment Trust (‘‘GBTC’’), a privately offered, open-end investment vehicle. Cryptocurrency operates without central authority or banks and is not backed by any government. Even indirectly, cryptocurrencies may experience very high volatility and related investment vehicles like GBTC may be affected by such volatility. As a result of holding cryptocurrency, the Fund may also trade at a significant premium to NAV. Cryptocurrency is also not legal tender. Federal, state or foreign governments may restrict the use and exchange of cryptocurrency, and regulation in the U.S. is still developing. Cryptocurrency exchanges may stop operating or permanently shut down due to fraud, technical glitches, hackers or malware. Detailed information regarding the specific risks of ARKW ETF can be found in the prospectus. Additional risks of investing in ARKW include foreign securities, market, management and non-diversification risks, as well as fluctuations in market value and NAV.
The Fund’s exposure to cryptocurrency may change over time and, accordingly, such exposure may not always be represented in the Fund’s portfolio. Many significant aspects of the U.S. federal income tax treatment of investments in bitcoin are uncertain and an investment in bitcoin may produce income that is not treated as qualifying income for purposes of the income test applicable to regulated investment companies, such as the Fund. GBTC is expected to be treated as a grantor trust for U.S. federal income tax purposes, and therefore an investment by the Fund in GBTC will generally be treated as a direct investment in bitcoin for such purposes. See ‘‘Taxes’’ in the Fund’s SAI for more information.
The principal risks of investing in ARKQ: Equity Securities Risk. The value of the equity securities the Fund holds may fall due to general market and economic conditions. Foreign Securities Risk. Investments in the securities of foreign issuers involve risks beyond those associated with investments in U.S. securities. Consumer Discretionary Risk. Companies in this sector may be adversely impacted by changes in domestic/international economies, exchange/interest rates, social trends and consumer preferences." Information Technology Sector Risk. Companies may face rapid product obsolescence due to technological developments and frequent new product introduction, unpredictable changes in growth rates and competition for the services of qualified personnel. Detailed information regarding the specific risks of ARKQ ETF can be found in the prospectus. Industrials Sector Risk. Companies in the industrials sector may be adversely affected by changes in government regulation, world events and economic conditions. In addition, companies in the industrials sector may be adversely affected by environmental damages, product liability claims and exchange rates. Disruptive Innovation Risk. Companies that ARK believes are capitalizing on disruptive innovation and developing technologies to displace older technologies or create new markets may not in fact do so. Companies that initially develop a novel technology may not be able to capitalize on the technology. Companies that develop disruptive technologies may face political or legal attacks from competitors, industry groups or local and national governments. These companies may also be exposed to risks applicable to sectors other than the disruptive innovation theme for which they are chosen, and the securities issued by these companies may underperform the securities of other companies that are primarily focused on a particular theme.
Additional risks of investing in ARKQ or ARKW include market, management and non-diversification risks, as well as fluctuations in market value and NAV.
Shares of ARKW and ARKQ are bought and sold at market price (not NAV) and are not individually redeemed from the ETF. ETF shares may only be redeemed directly with the ETF at NAV by Authorized Participants, in very large creation units. There can be no guarantee that an active trading market for ETF shares will develop or be maintained, or that their listing will continue or remain unchanged. Buying or selling ETF shares on an exchange may require the payment of brokerage commissions and frequent trading may incur brokerage costs that detract significantly from investment returns
Portfolio holdings will change and should not be considered as investment advice or a recommendation to buy, sell or hold any particular security. Please visit www.ark-funds.com for the most current list of holdings for the ARK ETFs.
Moore's Law is the observation and prediction that the number of transistors on an integrated circuit (microchip) doubles approximately every two years, leading to exponential growth in computing power and efficiency while costs decrease, a principle that has guided the semiconductor industry for decades, though it faces physical limits and is evolving. It's an empirical trend, not a physical law, first described by Intel co-founder Gordon Moore in 1965.
A hyperscaler is a large-scale cloud service provider, like Amazon Web Services (AWS), Microsoft Azure, or Google Cloud, that offers massive, highly scalable computing resources (compute, storage, networking) through vast data centers, enabling on-demand access to services for everything from AI and big data to basic internet, platforms and software.
The information herein is general in nature and should not be considered financial, legal or tax advice. An investor should consult a financial professional, an attorney or tax professional regarding the investor’s specific situation. Certain information was obtained from sources that ARK believes to be reliable; however, ARK does not guarantee the accuracy or completeness of any information obtained from any third party.
ARK Investment Management LLC is the investment adviser to the ARK ETFs.
Foreside Fund Services, LLC, distributor.
Source: ARK Investment Management LLC, 2026, based on data from Artificial Analysis 2025a and OpenRouter 2026 as of January 13, 2026. For informational purposes only and should not be considered investment advice or a recommendation to buy, sell, or hold any particular security. Past performance is not indicative of future results. Forecasts are inherently limited and cannot be relied upon.
*TFS-Days is a measure of compute required to train a model. Wright’s Law states that for every cumulative doubling of units produced, cost will fall by a constant percentage. Sources: ARK Investment Management LLC, 2024. This ARK analysis is based on a range of data sources as of Jan. 9, 2024, which are available upon request. Forecasts are inherently limited and cannot be relied upon. For informational purposes only and should not be considered investment advice or a recommendation to buy, sell, or hold any particular security. Past performance is not indicative of future results.
Source: ARK Investment Management LLC, 2026, based on data from Artificial Analysis 2025a and OpenRouter 2026 as of January 13, 2026. For informational purposes only and should not be considered investment advice or a recommendation to buy, sell, or hold any particular security. Past performance is not indicative of future results. Forecasts are inherently limited and cannot be relied upon.
Note: “CAGR”: Compound annual growth rate. Source: ARK Investment Management LLC, 2026, based on data from Morgan 2025a, Morgan 2025b, Morgan 2024 as of October 27, 2025. For informational purposes only and should not be considered investment advice or a recommendation to buy, sell, or hold any particular security. Past performance is not indicative of future results. Forecasts are inherently limited and cannot be relied upon.
ARK’s statements are not an endorsement of any company or a recommendation to buy, sell or hold any security. ARK and its clients as well as its related persons may (but do not necessarily) have financial interests in securities or issuers that are discussed. Certain of the statements contained may be statements of future expectations and other forward-looking statements that are based on ARK’s current views and assumptions and involve known and unknown risks and uncertainties that could cause actual results, performance, or events to differ materially from those expressed or implied in such statements.
Explore ARK Funds
Featured Funds:
ARK Trade Notifications
ARK offers fully transparent Exchange Traded Funds (“ETFs”) and provides investors with trade information for all actively managed ETFs.
